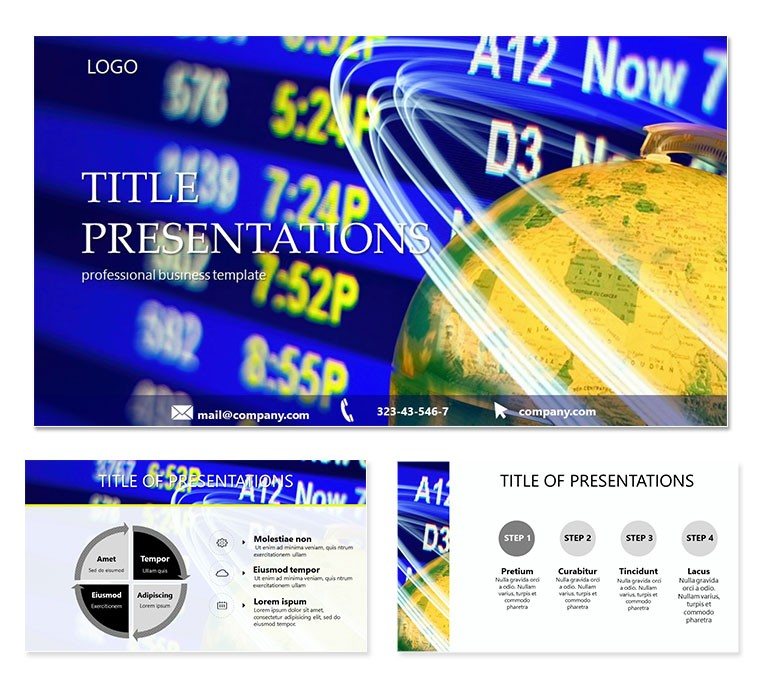
In an interconnected world, presenting complex economic ideas demands precision and poise. The Global Foundation PowerPoint Template empowers you to do just that, weaving intricate data into stories that inform and inspire. Tailored for leaders navigating international markets, this template turns abstract concepts like trade dynamics and fiscal policies into visually arresting decks.
What sets it apart? A sophisticated design that mirrors the stability of global foundations - clean lines, balanced layouts, and a palette evoking trust and growth. Whether dissecting GDP fluctuations or outlining sustainable development goals, it`s your ally in high-level discussions.
With PowerPoint`s ubiquity, compatibility is key. This template shines on Windows and Mac, from Office 2016 onward, making it accessible for teams worldwide. Say goodbye to bland spreadsheets; hello to presentations that command respect.
Core Features for Strategic Impact
At the heart of this template are 28 diagram slides, each a canvas for economic visualization. Seven color schemes - ranging from corporate grays to vibrant earth tones - let you adapt to any boardroom vibe. Three master slides ensure thematic consistency, while three backgrounds provide subtle depth without distraction.
- Editable Vectors: Scale charts and icons without quality loss, ideal for zooming into regional data.
- Animation-Ready: Built-in transitions reveal insights progressively, building suspense in your narrative.
- File Formats: Includes .pptx and .potx for easy import and sharing across platforms.
- Trend-Aligned: Incorporates 2025 design trends like minimalism and data storytelling for modern appeal.
According to a 2024 McKinsey report, executives using visual aids in global strategy sessions see 35% higher decision-making speed. This template delivers that advantage, straight out of the box.
A Closer Look at the Slide Arsenal
Slide 1 kicks off with a world map overlay for geopolitical overviews, seamlessly transitioning to pie charts on slide 5 for market share breakdowns. Deeper in, you`ll find Gantt charts for project timelines and Sankey diagrams for resource flows - tools rarely found in standard libraries.
Integration? Effortless. Pull in live data from Tableau or Excel, then apply the template`s smart placeholders. For analysts, this means real-time updates during volatile market talks, keeping your content fresh.
Envision a UN conference: Use slide 12`s bubble chart to plot inequality indices across nations, sparking dialogue. Or in a corporate merger pitch, leverage the org chart slide to illustrate post-integration structures. Precision meets persuasion.
Versatile Use Cases in Business and Beyond
This template`s breadth spans sectors. In finance, it`s gold for annual reports - bar graphs on slide 18 track currency trends with pinpoint accuracy. Consultants deploy it for client audits, where waterfall charts on slide 24 decompose profit variances.
Educators in international relations courses appreciate the timeline slides for historical economic events, fostering deeper student engagement. Researchers presenting at forums like Davos find the scatter plots invaluable for correlation studies between trade and growth.
Sales pros in export firms use it to demo supply chain efficiencies, with process maps highlighting cost savings. A 2025 World Bank study underscores how such visuals can sway policy, amplifying your influence.
Corporate Scenario: Economic Forecast
Build a forecast deck: Start with macro indicators via line graphs, pivot to sector-specific funnels, and end with scenario modeling. Download instantly to refine your outlook.
Academic Application: Policy Analysis
Dissect trade agreements with comparative tables and heatmaps, making dense topics approachable for learners.
Template vs. Vanilla PowerPoint: A Clear Winner
| Feature | Standard PowerPoint | Global Foundation Template |
|---|
| Diagram Depth | Basic shapes | 28 specialized economic visuals |
| Customization | Manual tweaks | 7 schemes + vector edits |
| Thematic Fit | Neutral | Global economy-focused |
| Efficiency | Slow build | Quick assembly |
| Cross-Platform | Good | Enhanced with masters |
The gap is evident: This template accelerates from concept to completion, elevating your expertise.
Streamlined Workflow and Lasting Value
Setup takes seconds - open .pptx in PowerPoint, tweak via the master view, and export to video for webinars. Lifetime access means evolving with your needs, no renewals required.
Enhance with add-ons like Mentimeter for polls or Power BI for dashboards. It`s not just slides; it`s a strategic asset. Customize now and fortify your global discussions.
Frequently Asked Questions
Which PowerPoint versions support this?
Compatible with 2016 and later, across Windows, Mac, and web versions for broad accessibility.
What`s the slide count?
28 diagrams, bolstered by three masters and backgrounds for a robust foundation.
Commercial rights included?
Yes, unlimited use for business, with full ownership post-purchase.
Editable for branding?
Totally - colors, fonts, and layouts adapt seamlessly to your style.
Best for global topics?
Precisely, with maps and charts tailored for international economics.
How to update data?
Link to external sources for automatic refreshes, keeping presentations current.