 Click to zoom
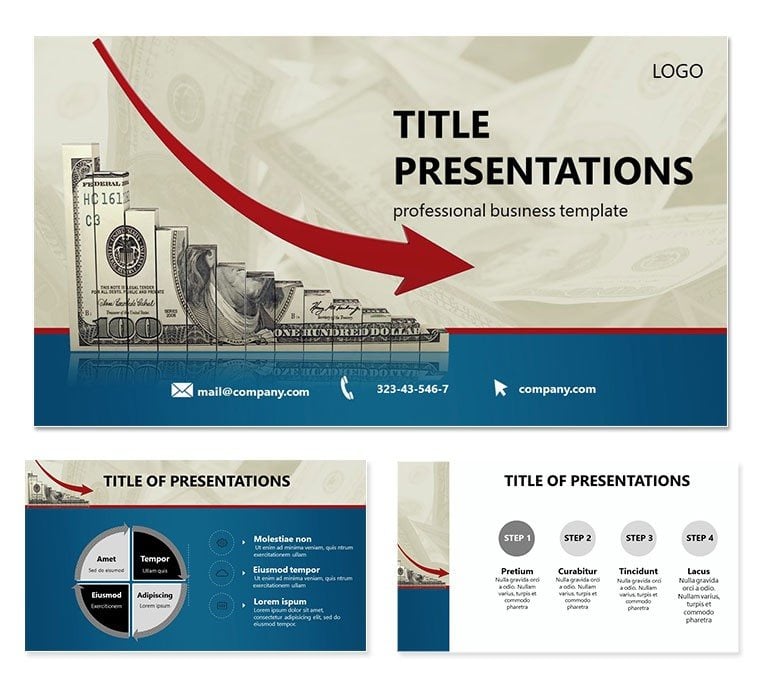
Dollar Decline Trends PowerPoint Template
| Format | .pptx |
| Slides | 3 unique layouts |
| Aspect ratio | 16:9 |
| Compatibility | PowerPoint |
| Animated | No |
| Language | English |
| License | Commercial |
| File size | — |
| Version | v1.0 |
| Last updated | October 2022 |
What's inside
When currencies wobble, your presentations need to stand firm. The Dollar Decline Trends PowerPoint Template equips forex analysts and economists with 28 precision diagrams in seven monetary color schemes, three masters, and backgrounds that echo exchange tickers. For PowerPoint users tracking devaluations, it demystifies dips with editable elegance.
Move past pixelated plots; this template forges downward arrows into insightful arcs, from candlestick forecasts to correlation matrices. Vector-sharp in PowerPoint 2016+, it`s primed for volatility reports or policy briefs, where every tick matters.
Monetary Features for Market Mastery
Seven color schemes signal sentiments - fading greens for slides, stark yellows for warnings - mirroring trading floors. Masters frame from macro overviews to micro metrics, backgrounds subtle as gridlines.
- 28 Financial Diagrams: Trend lines for USD vs. EUR, heat maps for inflation ties, funnel drops for reserve drains.
- Dynamic Edits: Update via linked tables, recolor bars to flag thresholds.
- Export Ease: .potx files for teams, jpgs for briefs.
A trader layered tariff impacts on decline curves, clinching a client hedge. It`s the pivot for persuasive forecasts.
Trade Path: Assembling Your Decline Deck
- Open Markets: Load in PowerPoint, opt for `Bearish Bronze` scheme.
- Plot the Plunge: Feed rate data into line charts, auto-smoothing curves.
- Correlate Factors: Venn overlaps for trade war effects, text-boxing causals.
- Animate Alerts: Stagger reveals to pulse on key drops, heightening drama.
- Close Positions: Package as interactive PDF for stakeholder scans.
This sequence trades time for targeted impact.
Scenarios in Currency Currents
For central bankers, scatter plots link rates to GDP, plotting policy pivots. Investors use pyramids for portfolio exposures, tiering risk by asset. In academia, cycles trace historical crashes, from Plaza Accord to now.
It`s the compass for charting choppy waters, from briefings to bond auctions.
Forex Finesse Tips
Declutter: Focus one metric per slide, like a clean ticker. Morph transitions for fluid rate flows. Inject wit - a `plummeting penny` icon for levity.
Better than basics, its motifs mint credibility, like a vault of verified visuals.
Syncing with Your Trading Terminal
Pulls from Bloomberg APIs via embeds, portable for laptop lurks.
Acquire the Dollar Decline Trends PowerPoint Template for $22 and steady your slides.
Frequently Asked Questions
PowerPoint compatibility details?
From 2016 onward, with full Office suite support.
Handling real-time data?
Link to Excel for auto-refreshes in presentation mode.
Custom currency icons?
Includes globals; add via insert for locales.
Animation options?
Pre-set fades; customize paths for trend traces.
File delivery?
.potx primary, with jpg diagram sheets.
Good for
- Project roadmaps and sprint plans
- Product launch timelines
- Quarterly or annual review decks
- Company history and milestone summaries
Licence
reviews
The shoe icons are fine but the footprint diagram is very specific.
Used the running track layout for a sports science presentation.
The sneaker design chart is cool.
The shoe size chart is accurate.
Its a great pack for footwear designers.
FAQ
Will it work in Google Slides?
Are fonts embedded?
Can I use this for client work?
What's the refund policy?
Do you update the template after purchase?
Similar templates
See all PowerPoint Templates →


All 1 slides