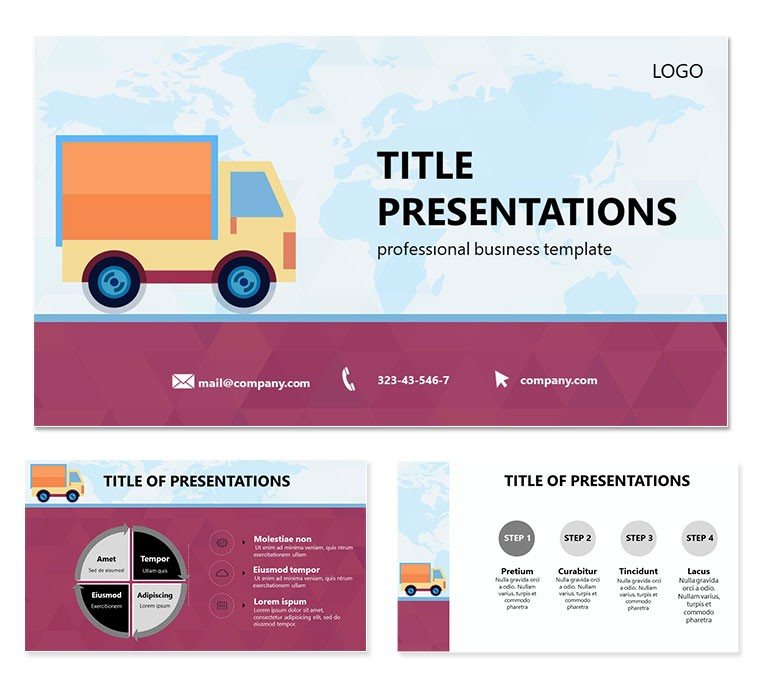
Where routes converge and timelines tighten, your logistics presentations must deliver punch. This Cargo Delivery PowerPoint template, featuring 28 dynamic diagrams in 7 color schemes, three masters, and three backgrounds, is for supply managers tracking from dock to door. Infographics turn chaos into choreographed flows.
Customize timelines for route optimizations or metrics dashboards for KPI spotlights. A logistics lead leveraged the convoy diagram for fleet deployments, convoying trucks in formation to underscore efficiency.
Dynamic Features: Flowing Freight Visuals
Charts pulse with motion - arrows for hauls, bars for volumes. Masters for route maps; backgrounds warehouse-inspired.
- Delivery Icons: Trucks, crates, scanners.
- Scheme Routes: Seven, earthy to high-vis.
- Infographic Layers: Stackable for depth.
PowerPoint 2016+, versatile exports.
Charting Cargo Configurations
The supply chain snake winds from source to sink. Segment for delays.
- Plot key nodes.
- Input metrics.
- Color code statuses.
- Animate progresses.
Performance reviews use gauge diagrams for on-time rates.
Delivery Use Cases: From Warehouses to Boards
Managers map distributions; execs forecast capacities. Impactful logistics narratives.
Delivery Tips
Geo-tag slides. Download for $22.
Frequently Asked Questions
Chart dynamics?
Animated for movement.
Supply focus?
Yes, chain-specific.
Colors?
Seven practical.
Edits?
Full vector.
For teams?
Collaborative ready.