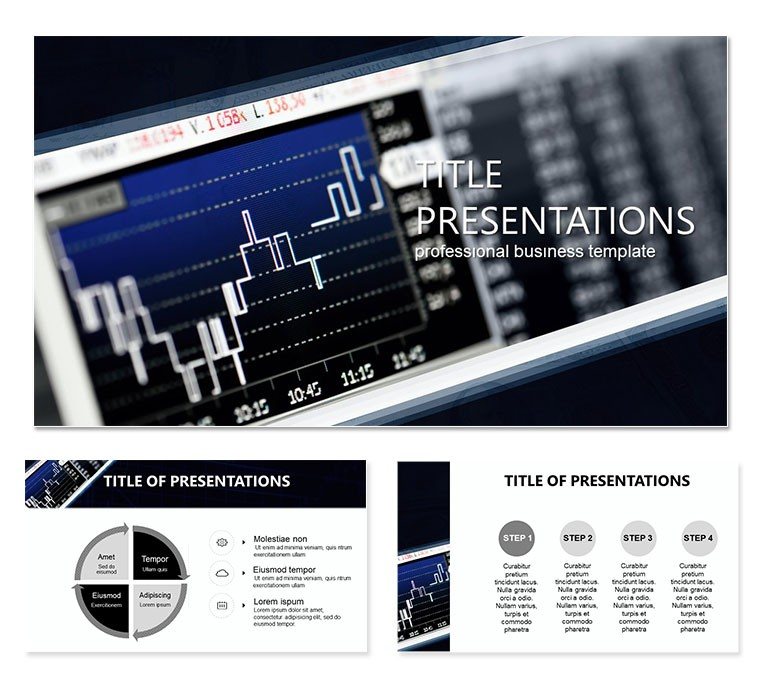
In the high-stakes world of capital management, where every decision hinges on precise evaluations, your presentations need to match that intensity. Enter our Evaluation Quality Capital Management PowerPoint template - a robust toolkit designed for finance pros and consultants who demand visuals as sharp as their analyses. With 28 diagrams ready to map out asset allocations, risk assessments, and performance metrics, this template turns complex spreadsheets into strategic stories that captivate investors and executives alike.
Crafted for those navigating the nuances of quality capital oversight, it tackles the frustration of generic slides that dilute your expertise. Three master layouts provide a foundation that`s easy to brand, while three background themes - from minimalist grays for formal reports to vibrant accents for dynamic pitches - set the tone. Seven color schemes ensure your charts align with corporate palettes, whether highlighting ROI trends or compliance checkpoints, all while keeping the focus on actionable insights.
Financial analysts, portfolio managers, and C-suite advisors will find immediate relief in its versatility. Envision quarterly board meetings: plug in your latest valuation data to a Sankey diagram, and watch liquidity flows come alive, sparking questions that lead to smarter allocations. Or, in client consultations, leverage the SWOT matrices to evaluate investment quality, building trust through transparent, visually compelling breakdowns. This template isn`t merely a file; it`s a partner in persuading stakeholders that your capital strategies are built to last.
Essential Features for Precision Presentations
At the heart of this template are 28 diagrams, each engineered for depth and adaptability in PowerPoint 2016+. Begin with the overview dashboard slide, a multi-panel layout that consolidates key metrics like capital adequacy ratios and stress test outcomes. Edit the gauges and bars directly, linking them to live Excel data if needed, for updates that feel effortless.
Delve into the analytical tools: pie charts for portfolio diversification evolve into interactive segments you can explode for emphasis, while line graphs track quality metrics over fiscal quarters with trend lines that auto-populate. The inclusion of 60+ finance icons - from balance scales to growth arrows - adds polish without clutter, ensuring every slide reinforces your narrative.
- Adaptive Designs: Resize elements without distortion, perfect for varying screen sizes in hybrid meetings.
- Integrated Tools: Built-in formulas for basic calculations, like yield computations, streamline prep.
- Export Options: .jpg and .potx files let you repurpose visuals for emails or whitepapers.
These elements draw from proven financial deck structures, emphasizing hierarchy to guide viewers from big-picture overviews to granular details, much like how top consultancies structure their deliverables.
Applying the Template: Strategies That Drive Results
Let`s map it to real scenarios. As a risk officer preparing an annual review, select the heatmap diagram (slide 15) to visualize exposure levels across asset classes. Input your volatility scores, apply a color gradient from the schemes, and instantly reveal hot spots - ideal for recommending hedges that protect capital integrity.
- Gather Insights: Compile your evaluation data, from audit scores to benchmark comparisons.
- Assemble the Deck: Layer in the Gantt chart (slide 8) for project timelines tied to capital deployments.
- Polish for Impact: Add subtle transitions to unveil forecasts, rehearsing to time revelations with your talking points.
For venture capitalists pitching fund performance, the funnel slide (slide 20) illustrates deal progression, quantifying quality filters that weed out underperformers. This approach contrasts sharply with vanilla PowerPoint builds, where alignment issues distract; here, smart guides snap everything into place, freeing you to refine arguments.
In team workshops, use the mind map (slide 25) to brainstorm capital optimization tactics, with branches for scenarios like mergers or expansions. Its collaborative-friendly design shines in shared editing sessions, fostering buy-in across departments.
The Edge in Capital Evaluation Visuals
This template distinguishes itself through its balance of sophistication and simplicity. Whitespace abounds to let data breathe, while consistent typography ensures readability from afar. A project lead once adapted these for a merger analysis, crediting the clear causality diagrams for clarifying synergies that sealed the deal.
Whether dissecting ESG factors in investments or forecasting cash flows, the tools empower you to convey quality without overwhelming. Accessibility tweaks, like alt-text ready placeholders, broaden reach too.
Elevate your capital management discourse - grab this template for $22 and forge presentations that fund futures.
Frequently Asked Questions
Is this template compatible with older PowerPoint versions?
It requires PowerPoint 2016 or later, but you can save as .ppt for compatibility checks.
How many color options are available?
Seven distinct schemes, each optimized for both light and dark modes to suit any projection.
Can I integrate live data?
Yes, diagrams support Excel links, updating automatically when source files change.
What`s included beyond diagrams?
Three masters, three backgrounds, and an icon set tailored to finance themes.
Are there usage restrictions?
No, full commercial license included for unlimited professional use.
Does it support animations?
Pre-set fades and wipes enhance flow, fully editable for custom sequences.