 Click to zoom
Fundamental Market Analysis PowerPoint Template - Editable Diagrams | Instant Download
| Format | .pptx |
| Slides | 3 unique layouts |
| Aspect ratio | 16:9 |
| Compatibility | PowerPoint |
| Animated | No |
| Language | English |
| License | Commercial |
| File size | — |
| Version | v1.0 |
| Last updated | March 2026 |
What's inside
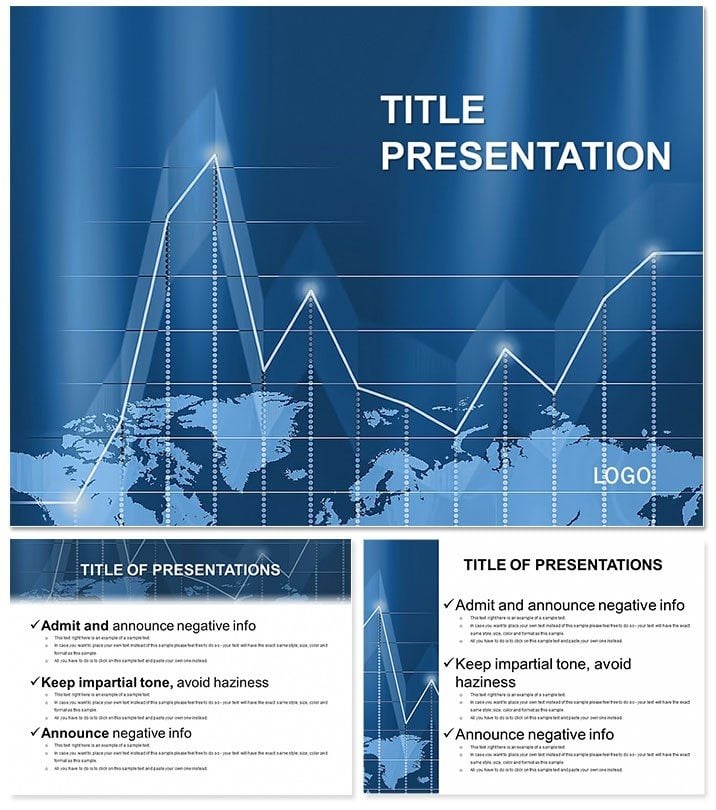
Get the Fundamental Market Analysis PowerPoint Template with 28 editable diagrams in 7 color schemes. Perfect for financial reports, investor pitches and business strategy presentations. Compatible with PowerPoint. Instant download.
What's Included
The Fundamental Market Analysis PowerPoint Template includes 28 diagrams in 7 color schemes as displayed on the page. The file is .pptx format with product ID 4795. Tags state Fully Editable and Compatible with PowerPoint. The page lists the 28 Diagrams (7 Color Schemes) as the central feature alongside the title and related business templates such as Stock Analysis and Marketing Product Research. This positions the template as the dedicated fundamental analysis pack within the business category. You get the complete ready-to-use diagram set for market presentations.
Format and Compatibility
The single .pptx download opens directly in PowerPoint with all diagrams preserved for editing.
Key Features
The template focuses on fundamental market analysis visuals that differentiate it from narrower related packs like Crude Oil Prices or Euro Currency.
FeatureDetails28 DiagramsMarket analysis coverage7 Color SchemesCorporate color flexibilityFully EditableText and data changesPowerPoint CompatibleNative .pptx formatBusiness ThemeFundamental focusInstant DownloadReady to use immediatelyProfessional Use Cases
For Financial Analysts
A financial analyst at an investment firm used the 28 diagrams to present quarterly market fundamentals to portfolio managers. The structured visuals clarified valuation metrics and trends, supporting informed investment decisions during the review.
For Business Consultants
A strategy consultant preparing a client market entry report incorporated the diagrams to display competitive landscape and growth drivers. The consistent style helped the client team grasp the analysis quickly and approve the recommended actions.
For Corporate Executives
A VP of strategy at a manufacturing company employed the template for an internal board update on industry fundamentals. The diagrams made complex data accessible, facilitating productive discussion on future planning.
How to Customize
Download the .pptx file and open in PowerPoint. The diagrams are fully editable so select any element to update text or numbers. Choose from the 7 color schemes to match corporate branding. The straightforward workflow of open, select scheme, replace content and save lets you prepare a complete market analysis presentation rapidly.
Data Integration
Because the diagrams are editable you can insert your latest market figures directly while keeping the professional layout intact.
Why Choose This Template
Constructing 28 market analysis diagrams manually would require extensive charting skills and time. This template supplies the full fundamental-focused set with 7 color schemes and full editability already built in PowerPoint format. It stands apart from the related templates that target specific sectors like stocks or currency by covering broad fundamental analysis. The page confirms the 28-diagram count, fully editable tag and .pptx compatibility, delivering immediate professional results for any business or finance presentation.
Download now to elevate your market analysis presentations with ready diagrams.
How do I edit the diagrams in this template?Open the .pptx file in PowerPoint. All 28 diagrams are fully editable so click elements to modify text, data or shapes. Apply any of the 7 color schemes with one click for instant branding updates. Resize or reorder components as needed. The editable structure supports quick integration of your market data while preserving the fundamental analysis layout. Most users finish customization in under 25 minutes.
What software is required?The template is compatible with PowerPoint as stated on the page and provided in .pptx format. It works in desktop and online versions of PowerPoint with all diagrams and color schemes intact.
How many diagrams are included?There are exactly 28 diagrams included across 7 color schemes as listed on the product page. This provides full coverage for fundamental market analysis presentations.
Can I change colors to match my brand?Yes, the 7 color schemes allow instant switching to align with your corporate palette. PowerPoint updates all diagrams consistently when a scheme is selected, keeping the fundamental analysis visuals professional and on-brand.
What file format will I receive?You receive a single .pptx file that contains the complete 28 diagrams with 7 color schemes. The format is native to PowerPoint and supports full editing.
Is this suitable for investor presentations?Yes, the fundamental market analysis focus and clean editable diagrams make it ideal for investor pitches, board updates and strategy sessions. The professional structure helps communicate complex market data clearly to financial audiences.
Good for
- Project roadmaps and sprint plans
- Product launch timelines
- Quarterly or annual review decks
- Company history and milestone summaries
Licence
reviews
Presented a quarterly market fundamentals report to the investment committee, the valuation metrics and trend diagrams made the complex data digestible.
The corporate color schemes are safe, but the diagrams are very standard finance; I felt like I was using a generic Bloomberg terminal export.
The competitive landscape and growth driver displays helped my consulting client approve the recommended entry strategy quickly.
I used it for an internal board update, the 28 diagrams made the manufacturing data accessible to the non-finance executives in the room.
It is a reliable set of fundamental analysis tools, the .pptx format opened easily, but I wish there were more specific 'sector' focuses rather than broad market themes.
FAQ
Will it work in Google Slides?
Are fonts embedded?
Can I use this for client work?
What's the refund policy?
Do you update the template after purchase?
Similar templates
See all PowerPoint Templates →


All 1 slides