Imagine captivating your audience with crystal-clear visuals that turn complex global economic data into compelling stories. This Global Economy PowerPoint template is your go-to solution for professionals navigating the intricacies of international finance, trade dynamics, and market fluctuations. Whether you`re briefing executives on GDP growth or analyzing currency trends in a boardroom, these meticulously designed diagrams ensure your message lands with precision and power.
Crafted for economists, business analysts, and corporate strategists, this template transforms dry statistics into dynamic narratives. With its sleek, modern aesthetic and fully editable elements, you`ll spend less time formatting and more time focusing on insights that drive decisions. Compatible with PowerPoint 2016 and later versions, it offers a lifetime license for unlimited use, making it a smart investment for recurring presentations.
At just a one-time fee of $22, unlock endless possibilities to showcase economic forecasts, supply chain overviews, and investment opportunities. Why settle for generic slides when you can deliver polished, data-rich content that commands attention? Start customizing today and watch your presentations gain the edge they deserve.
Key Features of the Global Economy Template
This template stands out with its comprehensive suite of tools tailored specifically for economic storytelling. Here`s what sets it apart:
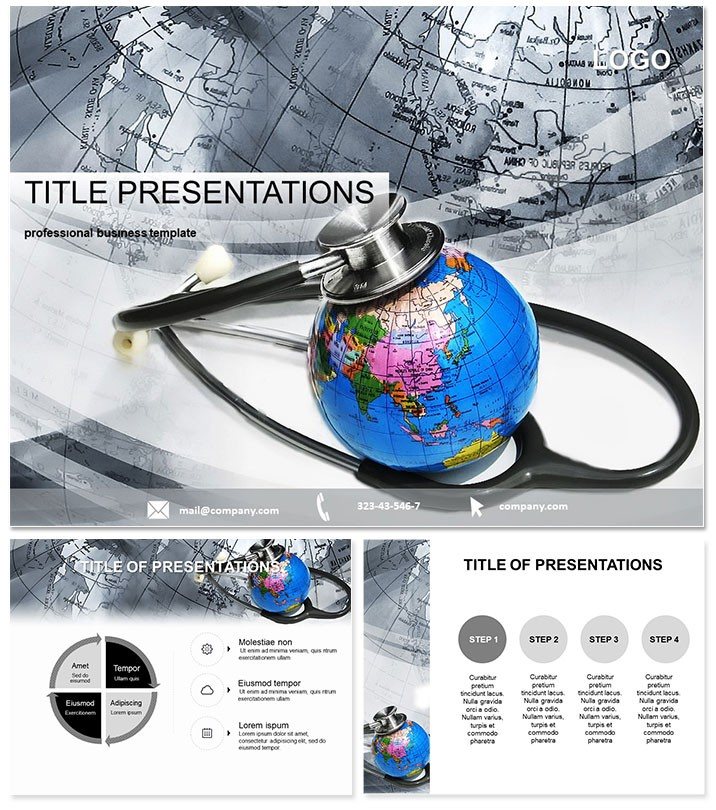
- 28 Editable Diagrams: From pie charts illustrating market shares to line graphs tracking inflation rates, each diagram is vector-based for seamless resizing without quality loss.
- 7 Versatile Color Schemes: Choose from professional palettes that evoke trust and clarity - think cool blues for stability or vibrant greens for growth - ensuring your visuals align with brand guidelines.
- 3 Master Slides and Backgrounds: Streamline your workflow with pre-configured layouts that maintain consistency across slides, saving hours of manual adjustments.
- Fully Customizable Elements: Swap data, tweak icons, and adjust animations to fit your narrative, all within PowerPoint`s intuitive interface.
- High-Resolution Sources: Includes .jpg previews, .pot templates, and .potx files for broad compatibility across devices.
These features aren`t just bells and whistles; they`re engineered to enhance readability and engagement, helping you convey multifaceted economic concepts like global trade balances or fiscal policy impacts with effortless sophistication.
How to Integrate This Template into Your Workflow
Getting started is as simple as opening PowerPoint and importing the template. Begin by selecting a color scheme that matches your company`s branding - perhaps a monochromatic scheme for formal reports. Then, populate the diagrams with your latest data: insert quarterly GDP figures into a bar chart or overlay regional trade volumes on a world map visualization.
For advanced users, leverage the master slides to embed your logo and footer notes automatically. Add subtle animations, like fade-ins for sequential data reveals, to guide your audience through layered insights without overwhelming them. The result? A seamless flow that keeps viewers hooked from the opening economic overview to the closing recommendations.
Pro tip: Pair this template with real-time data tools like Excel imports for live updates during virtual meetings, ensuring your presentations remain current in fast-paced economic environments.
Real-World Use Cases for Economic Professionals
In the high-stakes world of finance, clarity can make or break a deal. Consider a multinational corporation`s quarterly review: Use the template`s Sankey diagrams to illustrate cash flows across borders, highlighting bottlenecks in emerging markets. Stakeholders walk away not just informed, but inspired to act on your strategic advice.
For academic settings, professors teaching international economics can employ the radial charts to dissect supply-demand curves, making abstract theories tangible for students. Or picture a policy briefing at an international summit - your slides on sustainable development goals, visualized through interconnected node diagrams, could influence global agendas.
Even in consulting, where client pitches demand precision, this template shines. A recent user, a financial advisor, reported closing a $500K investment deal after using its timeline infographics to project ROI scenarios, crediting the visuals for simplifying complex projections.
Why This Template Outshines Default PowerPoint Options
Standard PowerPoint charts often feel clunky and uninspired, requiring endless tweaks to look professional. This template flips the script with pre-built, industry-specific designs that load instantly and scale beautifully. No more wrestling with misaligned axes or bland color defaults - everything is optimized for economic data, from logarithmic scales for exponential growth to thematic icons representing currencies and commodities.
Users appreciate the time savings: What might take hours in vanilla PowerPoint assembles in minutes here. Plus, its focus on accessibility - high-contrast elements and alt-text friendly structures - ensures inclusivity, a must for diverse global teams.
Ready to transform your next economic pitch? Download the Global Economy PowerPoint template now and experience the difference professional visuals make.
Frequently Asked Questions
What makes this template ideal for global economic presentations?
It features specialized diagrams like world maps and flow charts that simplify complex international data, ensuring your audience grasps key trends at a glance.
Is the template compatible with older PowerPoint versions?
Yes, it works seamlessly with PowerPoint 2016 and newer, including Microsoft 365, with full editability across platforms.
Can I use this for non-economic topics?
Absolutely - its versatile charts adapt well to any data-driven presentation, from marketing analytics to project timelines.
How many color options are included?
There are 7 professional color schemes, allowing quick customization to match your brand or audience preferences.
Does it come with a lifetime license?
Yes, your one-time purchase grants unlimited personal and commercial use forever.
Are animations included?
Basic entrance animations are built-in, but you can easily add or modify them in PowerPoint for dynamic reveals.