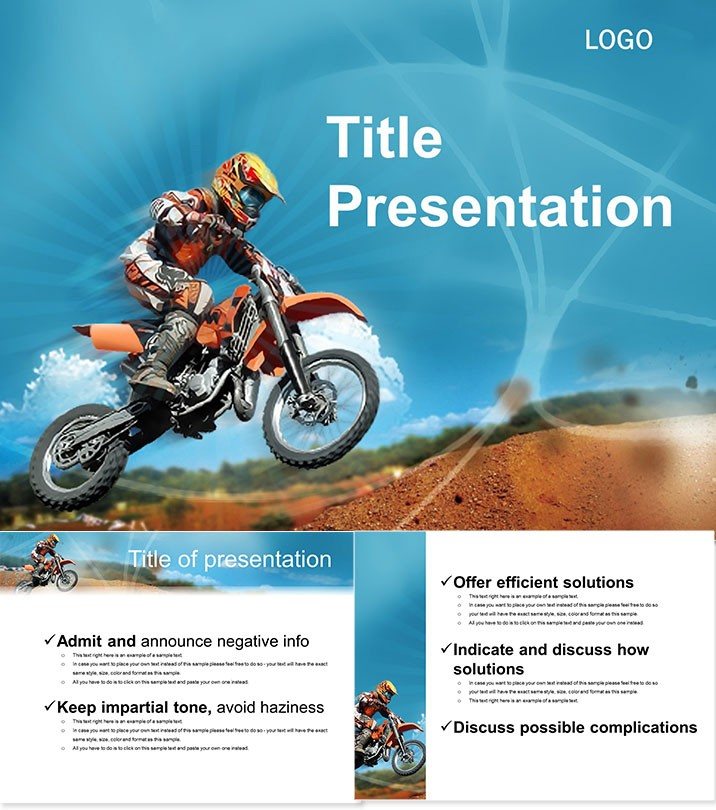
Feel the roar of engines and the rush of the apex as you gear up to deliver a presentation that corners like a pro racer. Our Motorcycle Track PowerPoint Template is engineered for motorsport enthusiasts, event organizers, and team managers, turning raw data on lap times and track strategies into adrenaline-fueled visuals that keep your audience in the fast lane.
Themed around the grit of dirt tracks and the precision of asphalt circuits, this template channels the intensity of extreme motorcycle competitions. Whether mapping out race schedules for sponsors or analyzing rider performance for coaching sessions, its rugged yet refined design ensures your points land with impact. Fully compatible with PowerPoint 2016 and beyond, it slots right into your toolkit. Secure lifetime use with a $22 one-time buy, making every presentation a victory lap.
Shift Your Presentations into Overdrive
Motorsports thrive on speed and strategy - your slides should too. This template ditches the drag of standard layouts for torque-packed graphics that visualize everything from pit stop efficiencies to wind tunnel simulations. It`s built to handle the heat, with durable vectors that withstand resizing and exporting, perfect for printed programs or digital recaps.
Customization cruises smoothly: Seven color schemes evoke trackside flags or sponsor liveries, while three masters let you switch between aggressive race modes and analytical debriefs. Backgrounds capture the blur of motion, immersing viewers in the event`s energy without overwhelming your core message. This isn`t just a tool; it`s a co-pilot for compelling narratives.
Engineered Features for Peak Performance
- 28 Action-Oriented Diagrams: Speedometer dials for velocity metrics and circuit loops for route optimizations.
- 7 Adrenaline Color Options: From fiery oranges to stealth blacks, tuned for high-visibility thrills.
- 3 Masters and Backgrounds: Versatile setups for race previews, live updates, or post-event summaries.
- Scalable Vector Graphics: Maintain sharpness at any zoom, ideal for large venue projections.
- PowerPoint-Optimized Files: .potx and .jpg sources for instant import and tweaks.
Navigating the Slide Circuit
Launch with Slide 1`s track overview map, plotting famous circuits like Monza or Laguna Seca for contextual hooks. Slides 2-5 accelerate into bar graphs comparing bike specs - horsepower vs. torque - racing data points to life.
Hit the straights with Slides 6-10: Gantt timelines scheduling event logistics, from qualifying heats to podium ceremonies. For tech dives, Slides 11-15 feature gear icon flowcharts dissecting suspension tuning, with adjustable nodes for variable conditions.
Corner into analysis territory on Slides 16-20, where scatter plots correlate weather impacts on lap records, pinpointing optimal strategies. Finish strong with Slides 21-25`s funnel diagrams for fan engagement pipelines, and 26-28`s radar webs evaluating rider skills across disciplines.
Track-Tested Scenarios for Motorsport Mavericks
Imagine a team principal unveiling seasonal goals: This template`s diagrams chart budget allocations against performance targets, clinching sponsor renewals. Or a journalist recapping a MotoGP weekend - visual timelines dissect controversial overtakes, drawing record readership.
In educational gears, instructors use circuit models to teach aerodynamics, sparking young riders` passions. Event planners, meanwhile, streamline vendor coordination via process maps, ensuring flawless executions that rev up repeat business.
Lapping Default PowerPoint Designs
Stock PowerPoint templates? They`re like stock bikes - reliable but uninspired. Ours injects nitro with motorsport motifs and built-in transitions mimicking gear shifts, trimming creation time by 60%. The payoff: Decks that don`t just inform but ignite excitement.
Ready to hit the throttle? Download now and race ahead of the pack.
Frequently Asked Questions
Compatible with which PowerPoint editions?
Works seamlessly with 2016 and later, across Windows and Mac.
Can diagrams handle custom data?
Yes, import Excel seamlessly for real-time updates.
How many color themes?
Seven, each evoking different track vibes for thematic fits.
Licensing details post-purchase?
$22 one-time for lifetime, multi-device access.
Suitable for non-racing topics?
Adaptable for any high-energy process or competition analysis.
Shift into high gear for your next event - customize your track to success today.