 Click to zoom
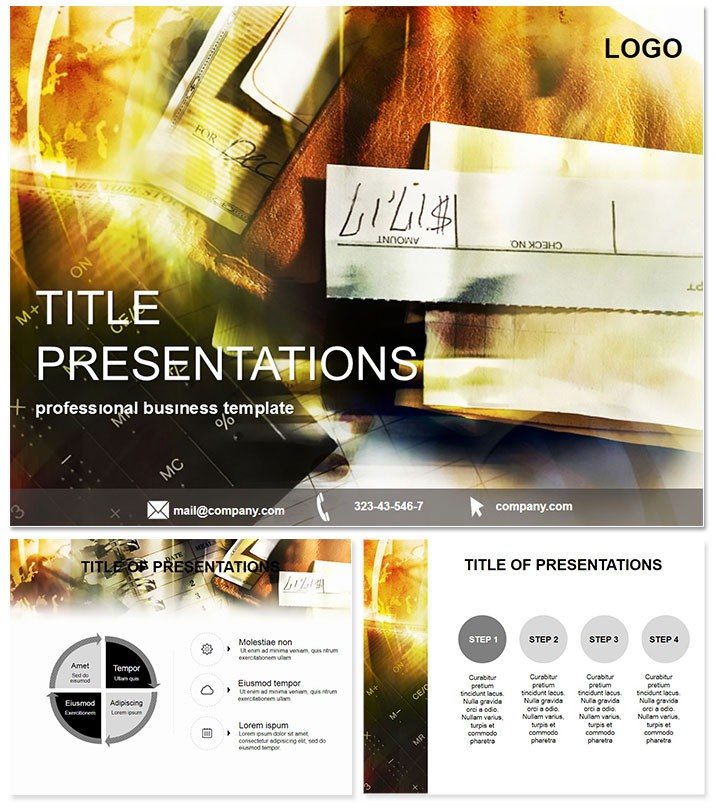
Income Tax Economy PowerPoint Diagram Template
| Format | .pptx |
| Slides | 3 unique layouts |
| Aspect ratio | 16:9 |
| Compatibility | PowerPoint |
| Animated | No |
| Language | English |
| License | Commercial |
| File size | — |
| Version | v1.0 |
| Last updated | October 2021 |
What's inside
Tax presentations don`t have to be a headache - envision slides that elegantly dissect income flows and market dynamics, leaving your audience enlightened rather than exhausted. Our Income Tax Economy PowerPoint Diagram Template is your ally in this, crafted for accountants, economists, and financial advisors aiming to demystify fiscal complexities with poise.
Boasting 28 slides rich in detail, it covers everything from tax brackets to economic forecasts. Fully compatible with PowerPoint 2016+, this $22 one-time purchase unlocks lifetime use, ideal for seasonal surges or ongoing advisory work.
Simplify Fiscal Narratives with Precision Design
Excel at illustrating deductions and revenues with diagrams that scale to your story`s needs. Tweak fonts, adjust scales, or infuse your data - all while preserving a sleek, authoritative look that commands respect.
Core Features for Financial Mastery
- 28 Insightful Diagrams: Tax pyramids, profit cycles, and market radars in 7 tailored color palettes.
- 3 Flexible Masters and Backgrounds: Ensure brand consistency with minimal effort across your entire presentation.
- Editable Vector Graphics: Resize without pixelation, perfect for detailed reports or quick overviews.
- Data Integration Tools: Pull in live figures from spreadsheets for always-accurate visuals.
- Comprehensive File Set: .potx for editing, .jpg for previews, ready for immediate deployment.
Such targeted tools not only save time but also elevate your expertise, turning viewers into advocates for your insights.
Slide-by-Slide Guide to Economic Clarity
The opener, slide 1, sets the stage with a comprehensive tax overview infographic. Slide 8`s bracket ladder climbs through income tiers with color-coded steps. Midway, slide 16`s economy wheel spins sectors like a dashboard, while closing slides 26-28 forecast trends via line projections, sparking strategic dialogues.
Every layout welcomes formula embeds, automating calculations for error-free delivery.
Targeted Scenarios for Finance Experts
An IRS consultant deploys this for client workshops, using profit diagrams to explain liabilities, streamlining compliance. In corporate finance, CFOs chart market impacts during earnings calls, with visuals that correlate taxes to growth, influencing investor confidence. Academic economists adapt for seminars, where cycle slides facilitate debates on policy effects.
Where default PowerPoint falters with generic grids, this template`s economy motifs - like currency symbols in flows - contextualize data, enhancing understanding and recall in high-pressure environments.
Outshine Ordinary Presentation Software
Beyond basic bars and lines, these diagrams weave tax themes into every element, making your deck a cohesive fiscal tale. Presenters reclaim 3-4 hours weekly, focusing on advice over aesthetics. Cross-platform reliability means no compatibility hiccups in global teams.
Empower your next fiscal review - acquire the Income Tax Economy PowerPoint Diagram Template immediately and tax your competition with superior style.
Frequently Asked Questions
What specific diagrams aid tax bracket explanations?
Ladder and pyramid styles on key slides visually stack tiers, simplifying progressive rates for any audience.
Does it integrate with financial software?
Yes, direct links to Excel and QuickBooks keep your tax data synchronized in real-time.
How customizable are the color options?
Seven schemes out-of-the-box, plus full palette editing via masters for precise branding.
What`s the total slide count and editability?
28 slides, each vector-editable for text, shapes, and data inputs without restrictions.
Tell me about the licensing and cost.
$22 one-time for lifetime access, covering commercial and personal uses indefinitely.
Are animations included for economic flows?
Subtle progressions animate cycles and projections, but fully removable for static preferences.
Good for
- Project roadmaps and sprint plans
- Product launch timelines
- Quarterly or annual review decks
- Company history and milestone summaries
Licence
reviews
Our accountant used this for a tax workshop and the tax pyramids and profit cycles were a huge hit. The market radars and bracket ladders for income tiers are very detailed.
The professional grays and accent hues color schemes are perfect for finance presentations. The ledger and grid backgrounds are well thought out.
Used this for an economic forecast and the economy wheels for sectors and line projections for trends helped us advise our clients. The partners were impressed.
Not bad but a bit too number-heavy for some clients
the dollar sign icons and calculator vectors are best for accounting pros. The excel links for live figures are a lifesaver.
the cycle slides for policy effects and formula embeds for error-free delivery are well organized. The 3-4 hours saved per week metric aligns with our experience.
FAQ
Will it work in Google Slides?
Are fonts embedded?
Can I use this for client work?
What's the refund policy?
Do you update the template after purchase?
Similar templates
See all PowerPoint Templates →

All 1 slides