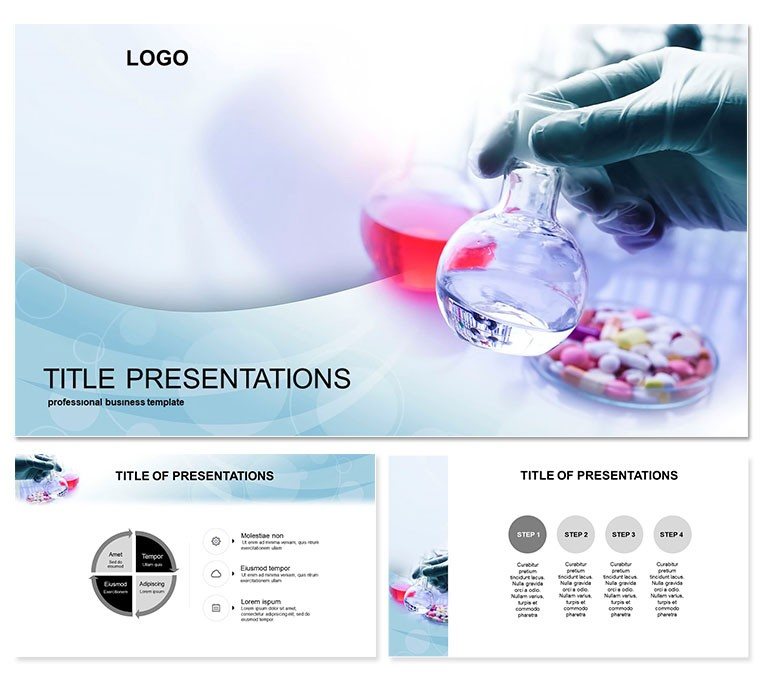
Unlock the intricacies of tablet production with a template that maps every step from raw mix to final pack, making complex manufacturing crystal clear. The Create Tablets PowerPoint Template is tailored for pharmaceutical and chemical professionals, offering a precise visual language to showcase processes, highlight efficiencies, and address challenges. Whether auditing lines or training staff, it empowers you to communicate with authority and precision.
Centered on industrial workflows, this template includes three master slides for phase breakdowns, three backgrounds evoking lab sterility, and 28 diagrams engineered for technical accuracy. Seven color schemes - clinical whites to cautionary reds - enhance data distinction. Optimized for PowerPoint 2016+, it handles detailed annotations without lag.
Precision Features for Process Pros
Engineering-grade icons and flow arrows ensure diagrams mirror real machinery, while sans-serif fonts deliver unerring readability. Layered elements allow drill-downs into sub-processes, turning overviews into deep dives.
- Three Masters: Process overviews, detail zooms, and compliance summaries.
- Three Backgrounds: Clean lab grids, flow schematics, and metric overlays.
- 28 Diagrams: Conveyor timelines, batch charts, and yield funnels.
- Seven Color Schemes: Hazard-coded for safety emphasis.
Eclipsing PowerPoint`s rudimentary shapes, these visuals simulate actual production, aiding comprehension at a glance.
Dissecting the Diagram Suite
The 28 slides trace the tablet lifecycle, each a blueprint for success:
- Raw Material Intake: Funnel diagram for sourcing and quality checks.
- Mixing Milestone: Blender icon flowchart for ingredient integration.
- Granulation Gate: Step ladder for particle formation stages.
- Compression Core: Press machine matrix for tablet shaping.
- Coating Cascade: Layered wheel for finish applications.
- Quality Quadrant: Inspection grid for defect detection.
- Packaging Pathway: Conveyor timeline to distribution.
- Yield Yearbook: Bar recap of output metrics.
The compression slide, with adjustable die icons, scales to your batch sizes dynamically.
Industry Applications That Deliver
Pharma execs pitched facility upgrades using the coating cascade, visualizing ROI and securing multimillion funding.
Chemical trainers deployed the granulation gate for onboarding, reducing errors by 18% through clearer visuals.
Beyond basic org charts, this template`s specificity drives decisions with data-backed narratives.
Manufacture Mastery Made Simple
Vector precision and quick exports streamline your prep. Lifetime license for $22 - build better processes forever.
Press your advantage - acquire the Tablets Manufacturing PowerPoint Template and refine your flow.
Frequently Asked Questions
Are the diagrams compliant with GMP standards?
Designs align with general pharma visuals; customize for specific regs.
Can I import real production data?
Yes, Excel-linked charts update seamlessly.
How detailed are the process icons?
High-fidelity, editable SVGs for accuracy.
Is it suitable for chemical vs. pharma only?
Versatile for both, with adaptable terminology.
What export options for reports?
PDF, high-res PNG for audits and prints.