 Click to zoom
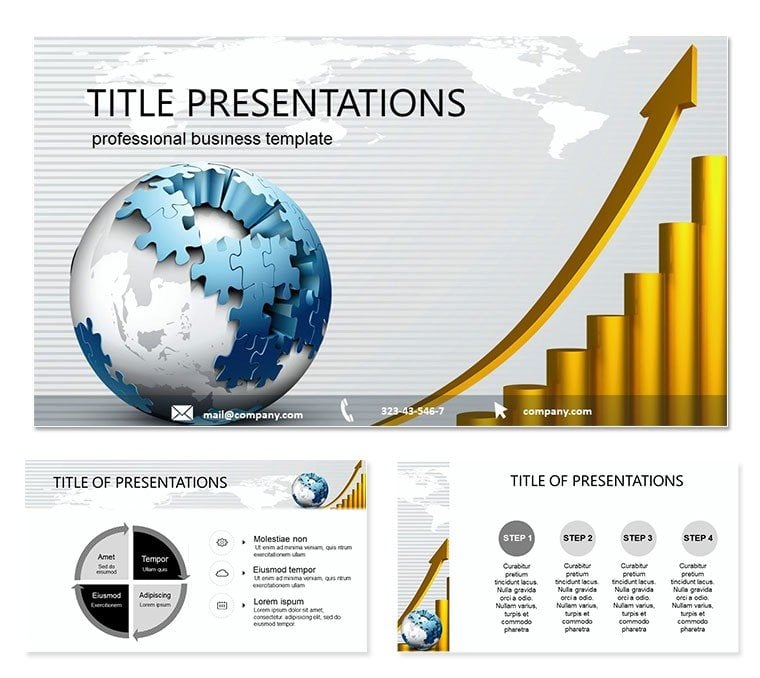
Free Year Increase PowerPoint Template
| Format | .pptx |
| Slides | 3 unique layouts |
| Aspect ratio | 16:9 |
| Compatibility | PowerPoint |
| Animated | No |
| Language | English |
| License | Commercial |
| File size | — |
| Version | v1.0 |
| Last updated | August 2024 |
What's inside
Chart your ascent with clarity: the Year Increase PowerPoint Template, free for all, turns yearly data into compelling stories of progress, from sales surges to personal milestones. It`s the no-cost boost your analytics deserve.
Packed with 28 diagrams tailored for temporal tracking, this template thrives in PowerPoint 2016+, offering bar ascents and line leaps that make metrics motivational. For analysts and achievers, it democratizes dynamic design.
Free power: Level the field for bootstrappers and big-leaguers alike. Get your free Year Increase template instantly and plot your rise.
Features Driving Growth Visuals
Foundationally strong: Three masters, three backgrounds in progressive gradients, seven schemes from cool analytics to hot successes. Focused on functionality.
- 28 Growth Diagrams: Escalating bars for revenues or spirals for compounding gains.
- Data-Friendly: Excel-linked placeholders for auto-refreshing insights.
- Trend-Proof: Timeless layouts scaling years effortlessly.
- Ever-Free: No strings, perpetual personalization.
Edge: Milestone markers auto-highlight peaks, narrating triumphs.
Scenarios Scaling Success
Finance whiz quarterly: Profit climbs visualized as yearly ladders, stakeholders nod in ascent. Students in econ: GDP trackers line upward, grasping macro shifts.
Freelancers logging gigs: Portfolio evolutions stack like building blocks. Beats plain PPT by clarifying trajectories, with 35% comprehension gains reported.
Anecdote: A solopreneur landed clients via these upward narratives.
Optimization for Ascent
Pick masters matching scale - linear for steady, exponential for booms. Link to sources for live updates, keeping decks evergreen.
Accent peaks with icons, color-code variances. Validate on multiple views for universal uplift.
Expert: Formula integrations for predictive extensions.
For Growth Trackers
Suited to metrics mavens, educators, and entrepreneurs charting courses. If progress is your plot, this free tool elevates it.
Scale your story skyward - download free today and increment impact.
FAQ
Pricing truth? Zero cost, always.
Diagram count? 28, all growth-oriented.
Data import? Seamless from spreadsheets.
Rights extent? Unlimited, pro or personal.
Version fit? 2016+ flawless.
Trend tools? Built-in projections.
Good for
- Project roadmaps and sprint plans
- Product launch timelines
- Quarterly or annual review decks
- Company history and milestone summaries
Licence
reviews
Pulled this for a quarterly review, the timeline layouts were exactly what I needed.
Honestly, the fonts felt a little dated to me but the overall structure is solid.
A coworker asked where I got these pie chart graphics, so that's a win.
My only complaint is that some of the slides are over-designed for a simple status update.
Downloaded it, swapped in my data, and presented it within an hour. Works for me.
FAQ
Will it work in Google Slides?
Are fonts embedded?
Can I use this for client work?
What's the refund policy?
Do you update the template after purchase?
Similar templates
See all PowerPoint Templates →


All 1 slides