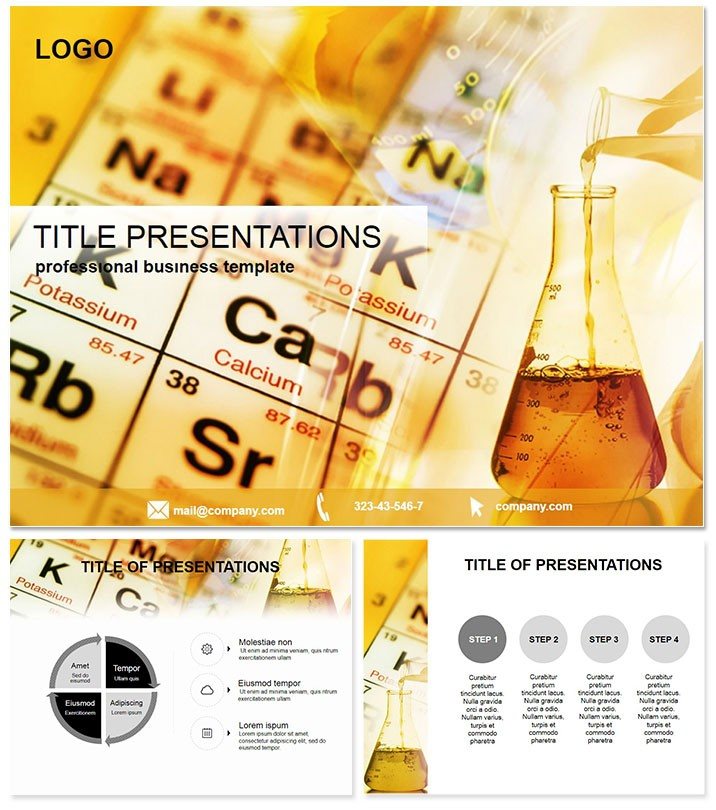
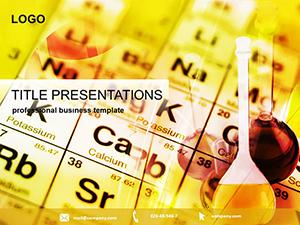
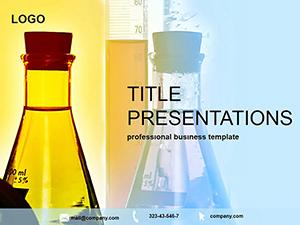
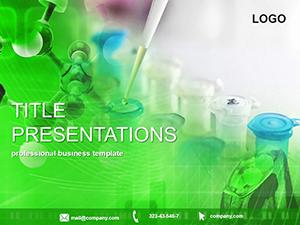
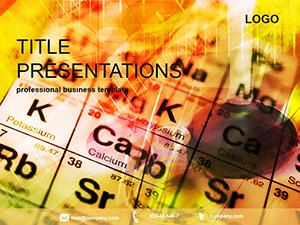
Step into a world where the periodic table comes alive, turning dense chemical data into visually stunning stories that spark curiosity and clarity. The Chemistry Table PowerPoint Template is crafted for scientists, teachers, and innovators who need to demystify molecular mysteries without sacrificing style. With its periodic table-inspired aesthetics, this tool equips you with 28 diagrams that elegantly map elements, reactions, and structures, making even the most intricate lab findings accessible to all.
What sets it apart in the lab of presentation tools? It`s more than slides - it`s a catalyst for understanding. Compatible with PowerPoint 2016+, this template blends education with engagement, ideal for classroom breakdowns of atomic bonds or boardroom overviews of R&D breakthroughs. Save precious prep time with ready-to-adapt visuals, and enjoy lifetime access from a single, straightforward purchase that fuels endless discoveries.
Essential Features for Scientific Precision
Explore the backbone of this template: a suite of features honed for the precision chemistry demands. The 28 diagram slides cover everything from valence electron configurations to reaction pathway timelines, each rendered in high-fidelity vectors for sharp, scalable prints or screens.
- 7 Thematic Color Schemes: Echo natural elements with schemes ranging from metallic silvers for industrial chems to earthy greens for organic compounds, ensuring thematic harmony.
- 3 Masters and Backgrounds: Subtle lab-inspired motifs keep your deck unified, with space for formulas or graphs without clutter.
- Intuitive Editability: Drag-and-drop placeholders for data, plus layer controls for overlaying molecular models - perfect for iterative research updates.
- Interactive Elements: Built-in hyperlinks for navigating between compound profiles, enhancing flow in live sessions.
These aren`t generic add-ons; they`re engineered for real scientific workflows, from Jupyter notebook exports to conference keynotes, all while maintaining cross-platform compatibility.
Practical Use Cases in Labs and Lectures
Envision a chemistry professor at a bustling university: using a layered periodic table slide to dissect isotope stability, her students nodding along as animations reveal electron shells unfolding. Or a pharma researcher pitching drug synthesis pipelines to investors, where pathway diagrams from this template highlight yield optimizations, securing funding on the spot.
In corporate training, HR teams adapt it for safety protocols, illustrating hazard symbols via icon grids. Academic conferences benefit too - presenters swap in custom data for thermodynamics cycles, drawing applause for visual elegance. Non-traditional users, like environmental consultants, map pollutant breakdowns with cycle diagrams, advocating policy changes with data-driven punch.
Versus vanilla PowerPoint`s basic tables, which blur under complex notations, this template`s structured grids and color-coded cells prevent overload, potentially doubling retention rates in educational settings.
Insights from Seasoned Users
A high school educator noted how the template`s balance equations slides made stoichiometry fun, boosting class participation by 40%. Such feedback validates its role as a trusted ally in science communication.
Elevate your next session - download and customize this chemistry powerhouse today.
Seamless Workflow Integration for Researchers
Import the .potx into your PowerPoint suite, and you`re set: populate tables with CSV imports, animate bonds forming in sequence, and export to interactive PDFs for peer reviews. For collaborative projects, cloud-sync compatible edits keep teams aligned, from initial hypotheses to final publications.
In fast-turnaround scenarios like grant proposals, the template`s speed - under 30 minutes for a full deck - means more time hypothesizing, less formatting. Its JPG assets double as social media teasers, extending reach beyond the room.
Advancing Knowledge with Elemental Visuals
Delve into niche applications: forensic analysts charting toxin traces with spectrum bars, or material scientists forecasting alloy behaviors via predictive models. These draw from actual lab protocols, where precise visuals correlate directly to breakthroughs.
As sustainability drives chem innovations, use eco-focused diagrams to showcase green syntheses, positioning your work at the forefront of global dialogues.
One-time investment, perpetual scientific utility - unlock it now.
Frequently Asked Questions
How does this template simplify periodic table explanations?
Through interactive, color-coded diagrams that highlight groups and trends at a glance.
Compatible with Google Slides?
Primarily for PowerPoint 2016+, but exportable to Google via PDF or images.
Can I add my own molecular structures?
Yes, editable layers support imports from ChemDraw or similar tools.
What`s the slide count?
28 core diagrams, expandable via masters.
Are animations included?
Yes, subtle transitions mimic reaction progressions.
Licensing details?
Lifetime access post one-time buy, for unlimited uses.