Unlock the narrative hidden in numbers with the Analytics Work PowerPoint Template, where raw data blooms into strategic blooms across 28 intuitive diagrams. For analysts and execs dissecting trends, this deck distills complexity into compelling clarity, ideal for reports that influence outcomes. PowerPoint 2016+ compliant, it arms you with modern aesthetics that make metrics memorable.
Feature Deep Dive
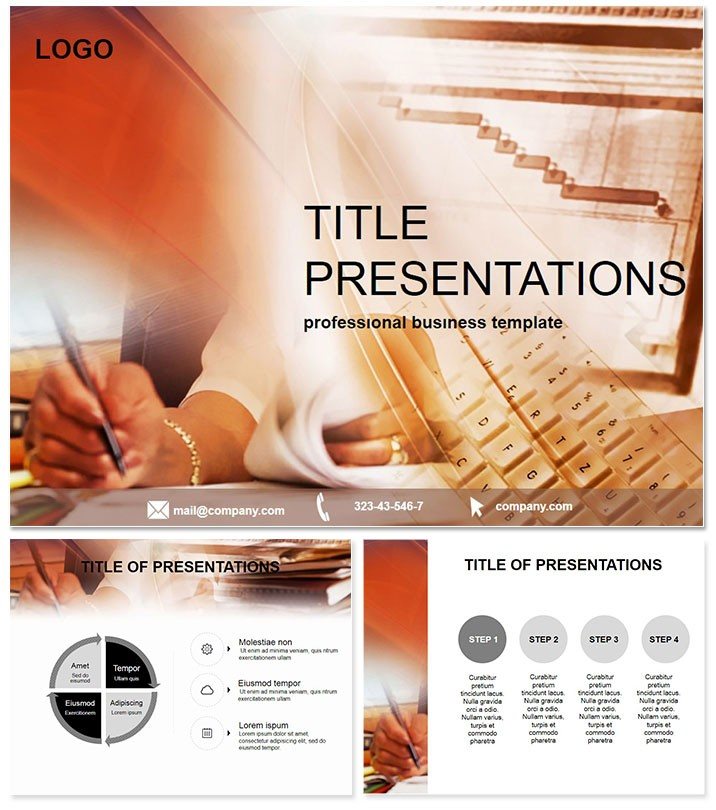
Three masters and backgrounds channel data flow serenity, 28 diagrams in seven schemes - from steel blues to alert reds - tailor to urgency levels. .jpg, .pot, .potx for fluid fixes. Grid icons and curve motifs ground abstract analytics.
- Three Masters: Data headers, insight cores, action tails.
- Three Backgrounds: Subtle grids and wave patterns.
- 28 Diagrams: Scatter plots for correlations, heatmaps for variances.
- Seven Color Schemes: Scalable for dark/light modes.
Precision engineering for peak performance in high-data environs.
Slide Spectrum Breakdown
Slide 1 charts a course with metric marquee. Initial inputs (2-6) funnel sources via trees. Mid metrics (7-21) magnify with gauges and funnels. End analytics (22-28) anchor with dashboards. Edit layers link seamlessly, placeholders for live feeds ready.
Insight Boost
Sync with Excel for real-time refreshes, keeping decks dynamically dated.
Analytics in Action
Consultants chart client ROI with layered lines, pinpointing pivot points for upsell. Educators unpack stats curricula via concept webs, clarifying correlations for cohorts. PMs track sprint velocities in burndown bars, aligning teams tighter. Firms like data agencies see 28% comprehension jumps from templated tells.
For board briefs, summary matrices merge multi-source stories succinctly.
Analytics Avant-Garde vs. Defaults
Basic builds buckle under bulk; this balances with smart scales and thematic threads that thread trust. Defaults demand drudgery - this delivers deftly. $22 entry to enduring analytics arsenal.
Chart Your Course Forward
Decode data destiny. Secure Analytics Work PowerPoint Template today and narrate numbers masterfully. One payment, infinite insights - advance now.
Frequently Asked Questions
Analytics focus areas?
Tailored for reports, trends, and performance analytics.
Software sync?
2016+ PowerPoint, Excel-integrated.
Palette plays?
Full flex - match any data dashboard.
Diagram dozen?
28 core, plus master multiples.
Buy blueprint?
$22 once, lifetime leverage.
Dynamic elements?
Yes, charts update on data drags.