Picture yourself in a boardroom, unveiling balance sheets that don`t just report numbers but tell a story of fiscal health and strategic foresight. The Financial Statements Balance PowerPoint Template delivers exactly that: a powerhouse of 28 diagrams engineered for precision in audits, market dives, and planning sessions. Tailored for finance pros who value clarity over complexity, it`s your go-to for presentations that command respect and drive decisions.
Compatible across PowerPoint 2016+, this template includes three masters and backgrounds, empowering you to craft narratives around equity, assets, and liabilities with effortless grace. For a modest one-time $22, gain lifetime access to tools that transform raw data into visual symphonies - customize on the fly to fit quarterly reviews or investor pitches.
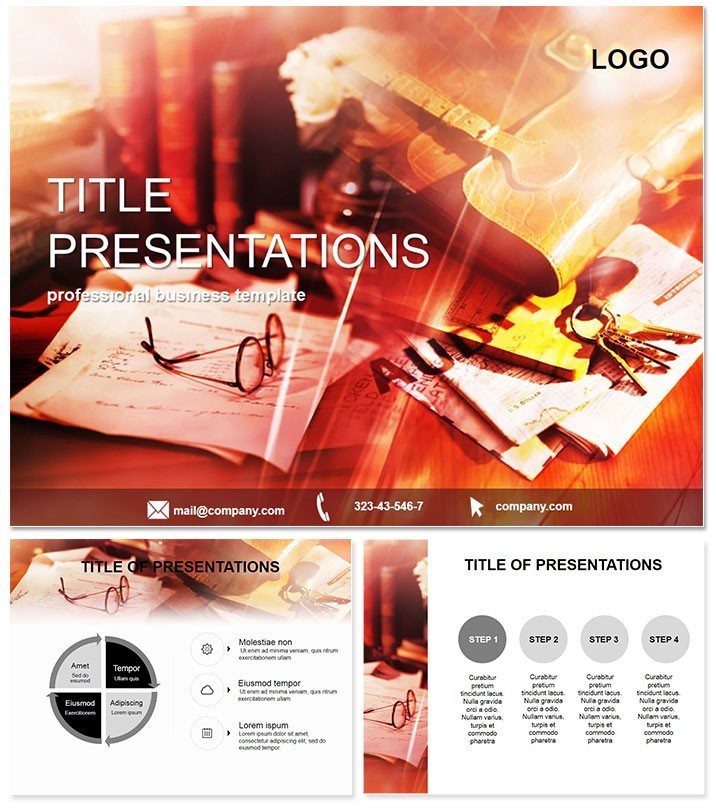
Standout Features for Fiscal Excellence
Flexibility defines this template, with seven vibrant color schemes that shift from conservative grays for formal audits to bold accents for dynamic forecasts. The 28 diagrams cover essentials like pie charts for asset allocation and line graphs tracing liability trends, all vector-sharp for flawless scaling.
- Data Integration: Effortlessly link to Excel for live updates during presentations.
- Professional Polish: Pre-set layouts that adhere to GAAP visuals, saving compliance headaches.
- Mobile Optimization: Responsive elements that shine on screens big and small.
These features aren`t add-ons; they`re the foundation for presentations that resonate long after the final slide.
Exploring the 28-Diagram Arsenal
Begin with foundational slides like Diagram 1`s balance equation visual, breaking down assets equaling liabilities plus equity in digestible segments. Slides 4-8 delve into comparative statements, side-by-side bar charts highlighting year-over-year shifts in working capital.
Core content shines in Slides 15-20: cash flow waterfalls that cascade from operations to financing, revealing liquidity stories at a glance. Conclude with ratio analyses on Slides 25-28, using gauges and radars to benchmark solvency against industry norms. Each slide builds progressively, creating a financial journey that`s as logical as it is luminous.
Superior to Vanilla PowerPoint Defaults
Where built-in tools falter with rigid grids and dated icons, this template injects sophistication - think animated inflows that mimic real cash movements, far beyond static inserts. Result? Faster prep times and audiences hooked from slide one.
Practical Scenarios Where It Shines
Envision a CFO presenting to auditors: leverage the statement reconciliations to preempt queries, turning potential scrutiny into collaborative insights. In a startup`s funding round, market analysis slides forecast balance growth, swaying investors with projected stability.
Accounting firms thrive too, using these for client deep-dives into economic indexes, where visuals clarify complex reports and foster trust. Users rave about 40% quicker comprehension in feedback loops, proving its edge in high-pressure finance arenas.
Seize the advantage - grab your Financial Statements Balance Template today and balance the scales in your favor.
Expert Hacks for Peak Performance
Layer in conditional formatting for auto-coloring thresholds, like red-flagging high debt ratios. Collaborate via shared .potx files for team refinements, and always preview in presenter mode to fine-tune pacing. These tweaks ensure your delivery is as sharp as your analysis.
Frequently Asked Questions
How does this template support audit preparations?
With dedicated reconciliation and ratio diagrams, it streamlines evidence presentation for seamless reviews.
Does it work with Mac PowerPoint?
Perfectly, with full fidelity across Windows and macOS versions from 2016 onward.
Can I incorporate real-time data?
Yes, via embedded Excel links that refresh dynamically for up-to-the-minute accuracy.
What if I need more than seven colors?
Edit any scheme manually; vectors make recoloring intuitive and instant.
Lifetime license details?
Covers unlimited edits and uses, with ongoing support baked in.
Customization time estimate?
Under 30 minutes for full branding, thanks to smart masters.