 Click to zoom
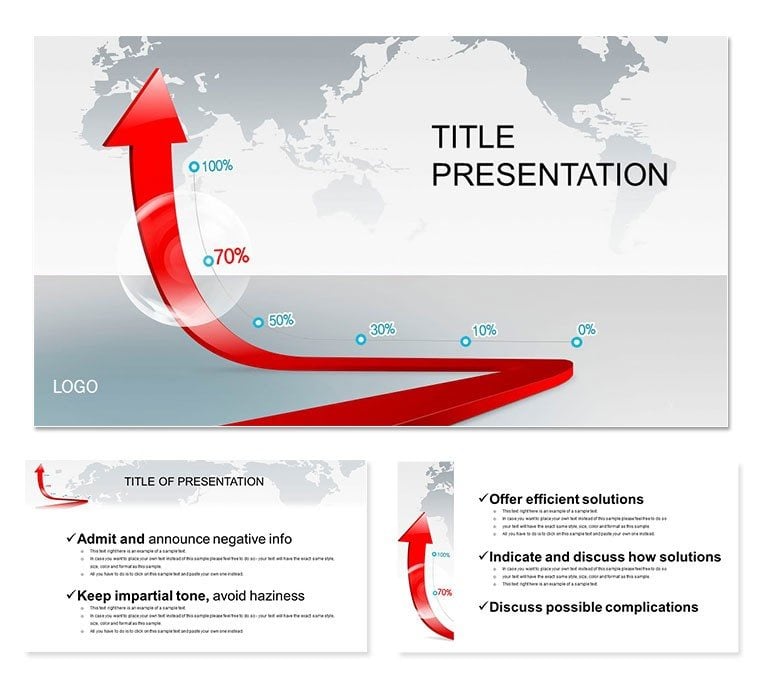
Growth Chart PowerPoint Template: Ascend with Data
| Format | .pptx |
| Slides | 3 unique layouts |
| Aspect ratio | 16:9 |
| Compatibility | PowerPoint |
| Animated | No |
| Language | English |
| License | Commercial |
| File size | — |
| Version | v1.0 |
| Last updated | September 2021 |
What's inside
In the arena of business intel, clarity climbs highest. The Growth Chart PowerPoint Template scales your stats into soaring stories, ideal for execs eyeing expansion. It demystifies developments, from sales spikes to factor fluxes, with designs that demand attention and deliver results.
From PowerPoint 2016 to 365, it thrives in shared environments, with a lifetime license for perpetual productivity. Rooted in analytical rigor, it`s your ally for reports that resonate.
Power Features for Peak Performance
Three masters ensure report rhythm, three backgrounds build momentum. 28 diagrams in seven schemes pinpoint progress precisely.
- Master Slides: Three for narrative arcs in reporting.
- Backgrounds: Three upward gradients for motivational backdrops.
- Diagrams: 28 tailored to trajectories: lines, areas, gauges.
- Color Schemes: Seven for metric mood - greens for gains, reds for reviews.
SmartArt synergies make data drops drag-and-drop simple, amplifying your analytical edge.
Navigating the 28-Slide Ascent
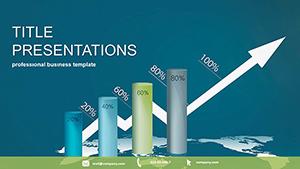
Lead with line charts climbing fiscal peaks, annotations auto-adjusting. Area fills layer contributions, shading overlaps for interplay insights.
Gauge dials meter milestones, needles twitching on updates. Pyramid stacks segment shares, apexes aiming high. Heat maps hue territories by tempo, hotspots heating debates.
These constructs convert chaos to charts, ready for revenue recaps or risk rundowns.
Applications Across Avenues
Finance heads forecast with line evolutions, swaying stakeholders on spends. Retail reps rally routes via area visuals, territories towering.
Consultants capstone cases with gauges, metrics mesmerizing. "Transformed our quarterly - crystal clear," raves a planner. From ops overviews to venture visions, it vectors victory.
Edge Over Everyday Edits
Default diagrams drag with dullness; this injects intent with interactive inclines. Faster formats, finer finishes - growth geared for glory.
Chart your course: Download Growth Chart PowerPoint Template now and surge ahead.
Frequently Asked Questions
Supported PowerPoint editions?
2016+, embracing 365`s cloud collab capabilities.
Metric matching methods?
Schemes and slots shift seamlessly to your stats.
Cross-OS operation?
Yes, Windows/Mac harmony in .potx purity.
Diagram diversity?
28 growth gears: lines, stacks, maps for mastery.
Licensing latitude?
Lifetime liberty post one-time transaction.
Linking live data?
Excel embeds ensure evergreen evolutions.
Good for
- Project roadmaps and sprint plans
- Product launch timelines
- Quarterly or annual review decks
- Company history and milestone summaries
Licence
reviews
The logo slides were great for a branding presentation.
Used the color swatches and font samples.
The design is very creative.
I like the mockups of business cards.
Good for a brand guide.
FAQ
Will it work in Google Slides?
Are fonts embedded?
Can I use this for client work?
What's the refund policy?
Do you update the template after purchase?
Similar templates
See all PowerPoint Templates →


All 1 slides