Open the .pptx file and you get 28 investment-focused energy diagrams across 7 color schemes, delivered in .pptx, .potx, and .jpg - $10 for the 3-master base theme, $20 for the complete diagram set. This PowerPoint diagram template is built specifically around renewable energy funding structures, not general-purpose business charts.
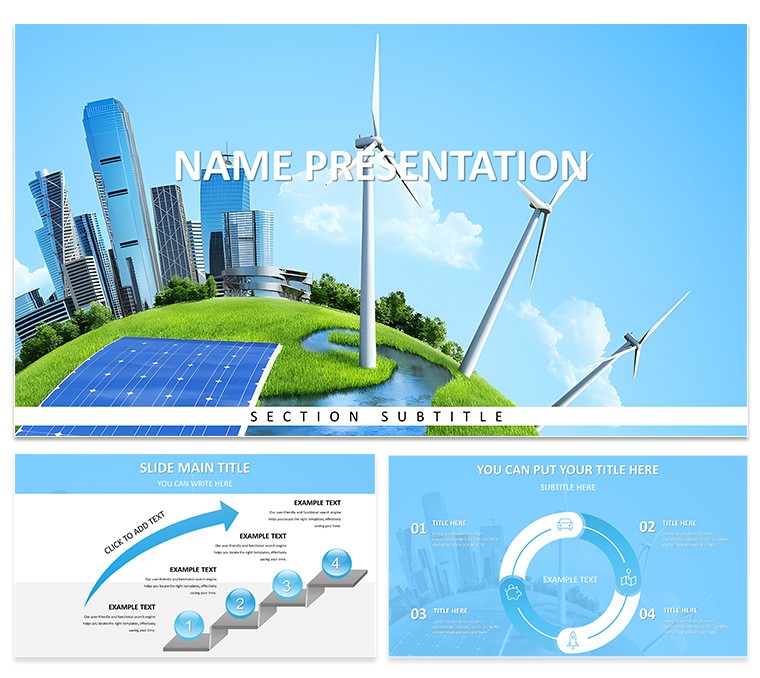
The diagram categories divide into two functional groups. The first covers investment pipeline and capital flow structures: staged funding diagrams, ROI comparison layouts, and portfolio allocation charts that map capital across energy source types. The second group handles impact and reporting: sustainability metric displays, project milestone timelines, and board-facing summary layouts. All shapes use flat, filled vector icons with no raster elements - scaling from laptop screen to boardroom projector produces no pixelation or edge artifacts.
Connector lines and arrows in each diagram adjust direction and weight independently without requiring shape regrouping. This matters for investment pipeline diagrams in particular, where the flow direction between funding stages frequently needs to be reversed or reordered as deal structures change during a project cycle. Zone fills communicate relative magnitude visually - a high-ROI block reads as heavier than a low-ROI block before any label is read - which is useful in live board settings where attention shifts between the presenter and the slide.
File formats are .pptx, .potx, and .jpg. PowerPoint 2016, 2019, 365, and the Mac version of PowerPoint open all 28 diagrams without file conversion. Color scheme changes apply globally via the slide master: go to View → Slide Master, select the top master slide, open the Colors dropdown, and choose one of the seven built-in palettes or enter custom brand hex values. All 28 diagrams update immediately. Per-slide overrides work without breaking the master configuration.
The $10 base purchase delivers 3 masters and 3 backgrounds only - no diagram slides. The $20 full version includes every diagram with all editable layers unlocked. Sustainability analysts, energy sector investment managers, and ESG report authors preparing board presentations or client fund updates are the primary users this diagram set addresses. For related coverage, the Plant Ecology Diagrams PPTX and Green Technology Renewable Energy Diagrams PPTX cover adjacent subject matter in the same format.
Download and start editing immediately
Specifications
| Feature | Details |
|---|
| Diagrams | 28 total - investment pipelines, ROI comparisons, sustainability metrics, milestone timelines |
| File format | .pptx, .potx, .jpg |
| Software version | PowerPoint 2016, 2019, 365, Mac |
| Color schemes | 7 - switch all 28 diagrams at once via View → Slide Master → Colors |
| Editable elements | Shapes, text placeholders, icon layers, connector direction and weight |
| Aspect ratio | 16:9 |
| Free vs Paid | Base ($10): 3 masters + 3 backgrounds. Full ($20): all 28 diagrams + 7 color schemes, no watermarks |
| Masters / Backgrounds | 3 masters, 3 backgrounds |
Frequently Asked Questions
Which PowerPoint versions are compatible with this template?
PowerPoint 2016, 2019, 365, and the Mac version of PowerPoint all open every diagram without file conversion. The slide master palette loads automatically so color scheme changes apply consistently across all 28 diagrams. Older versions of PowerPoint may require a one-time font substitution - that process takes under one minute - after which all shapes and connectors remain fully editable.
How do I change the color scheme across all 28 diagrams at once?
Color changes route through the slide master, not individual slides. Go to View → Slide Master, select the top master slide, and click the Colors dropdown. Choose one of the seven built-in schemes or enter custom hex values to match brand colors. Every diagram in the file updates immediately. Per-slide overrides are still possible - clicking a specific shape and editing its fill through Format → Shape Style applies a local change without resetting the master configuration.
Does the license cover client presentations and paid deliverables?
The license covers unlimited internal use and paid client work. Presentations built using this template can be delivered to external clients and included in commercial engagements. The license does not permit reselling the template source files themselves or distributing the .pptx or .potx as a standalone design product. Multiple team members may access the same purchased file under one license; contact ImagineLayout support for enterprise multi-seat pricing.
What is included in the base version versus the full paid version?
The $10 base version contains 3 masters and 3 backgrounds in .pptx and .potx format. No diagram slides are part of the base package. The $20 full version adds all 28 diagrams across all 7 color schemes with every shape and layer fully editable and no watermarks applied. The investment pipeline, ROI comparison, and sustainability metric slides are exclusively available in the full version.
What are the refund conditions?
Refund requests are accepted within 30 days if the file does not open in your stated version of PowerPoint. Submit the order number and a short description of the issue to ImagineLayout support. Approved refunds are processed within 48 hours. Refunds are not available after the file has been successfully downloaded and edited.