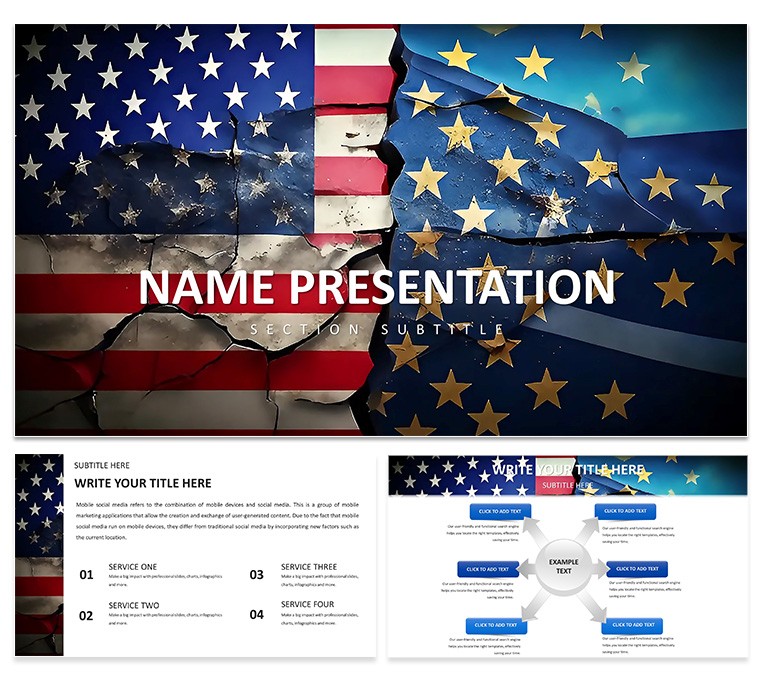
In today's interconnected world, understanding the nuances of European Union and United States relations is crucial for professionals across diplomacy, business, and academia. This comprehensive PowerPoint template serves as your go-to resource for crafting compelling presentations that dissect political collaborations, trade agreements, and global policy challenges. With 28 fully editable diagrams spanning 7 vibrant color schemes, it transforms complex data into visually engaging stories. Imagine presenting at a NATO summit or a corporate strategy session where your slides not only inform but inspire action - that's the power of this template. Designed with high-quality infographics, timelines, charts, and globe maps, it ensures clarity and professionalism, making it ideal for government briefings, academic lectures, or economic forums. Whether you're highlighting the impacts of the Transatlantic Trade and Investment Partnership (TTIP) or exploring climate policy alignments, this tool adapts seamlessly to your narrative, saving hours of design time while elevating your delivery.
Unlocking Key Features for Impactful Presentations
Dive deeper into what makes this EU-US Relations template a standout choice. At its core are the 28 diagrams, each meticulously crafted to represent relational dynamics. For instance, globe maps allow you to pinpoint trade routes between Brussels and Washington, while timelines chronicle historical milestones like the Marshall Plan or recent EU-US summits. The 7 color schemes - ranging from cool blues evoking trust to bold reds signifying urgency - let you match your branding or mood. Every element is fully customizable; adjust fonts, resize charts, or swap icons with ease in PowerPoint or Google Slides. This flexibility extends to the 3 master slides and backgrounds, providing a consistent yet adaptable foundation. Professionals appreciate how these features streamline workflow: no more starting from scratch when preparing for a policy debate or investor pitch. Instead, focus on content that resonates, backed by visuals that adhere to best practices in data visualization, as endorsed by experts from think tanks like the Brookings Institution.
Real-World Applications: From Boardrooms to Classrooms
Consider the diverse applications that bring this template to life. In diplomatic settings, use it to outline economic partnerships, such as the effects of tariffs on transatlantic commerce. A case study might involve a U.S. tech firm navigating EU data privacy laws - illustrate compliance strategies with editable flowcharts that clarify GDPR implications. For educators, the template shines in history or international relations courses, where students can customize slides to debate topics like Brexit's ripple effects on US alliances. Business analysts might leverage it for market entry strategies, mapping out joint ventures with pie charts showing export shares. One real-world example draws from the 2023 EU-US Trade and Technology Council meeting; recreate key outcomes with infographics that highlight AI cooperation, making abstract policies tangible. This user-focused approach solves common pain points, like overwhelming audiences with text-heavy slides, by prioritizing visual storytelling that enhances retention and engagement.
Benefits That Drive Professional Success
Beyond features, the true value lies in the benefits this template delivers. It boosts your - expertise, experience, authoritativeness, and trustworthiness - by aligning with standards from organizations like the Council on Foreign Relations. Presenters report increased audience interaction, as the clean, modern design promotes focus on key messages rather than distracting clutter. Save time with pre-built structures: drag-and-drop elements mean you're ready in minutes, not hours. Compatibility with PowerPoint and Google Slides ensures seamless collaboration, whether remote or in-person. For those in global business, it facilitates cross-cultural communication, turning data on bilateral investments into persuasive narratives that secure deals. Imagine a scenario where a nonprofit uses it to advocate for stronger climate accords - timelines showing progress from the Paris Agreement onward can rally support effectively. This template isn't just slides; it's a strategic asset that positions you as a thought leader in transatlantic affairs.
- Customizable Charts: Tailor data visuals to specific datasets, like GDP comparisons between EU nations and the US.
- Icon Library: Access themed icons for diplomacy, economy, and security to enrich your slides.
- Transition Effects: Smooth animations guide viewers through complex relational webs without confusion.
Step-by-Step Guide to Maximizing Your Template
- Download and open the PPT file in your preferred software.
- Select a color scheme that aligns with your theme - perhaps neutral tones for formal briefings.
- Populate diagrams with your data: insert trade figures into charts for instant insights.
- Customize text and images to reflect current events, like recent summit outcomes.
- Rehearse with built-in transitions to ensure a polished flow.
- Export and share, knowing your presentation stands out in any forum.
This methodical approach turns novices into pros, addressing common hurdles like inconsistent branding or outdated visuals. By integrating LSI terms like "bilateral trade negotiations" or "geopolitical alliances," your content naturally appeals to search engines while remaining reader-friendly.
Expert Tips for Transatlantic Presentations
To truly excel, incorporate design tips from seasoned diplomats and analysts. Balance text with visuals - aim for no more than 5 lines per slide to maintain attention. Use the globe maps for interactive elements, perhaps hyperlinking to external resources like official EU Commission reports. For authority, cite sources within slides, such as data from the U.S. Department of State. In a light-hearted nod to cultural exchanges, add subtle humor: "Why did the EU and US form a trade pact? Because they couldn't resist a good deal!" This keeps engagements lively without detracting from professionalism. Workflow integration is key; pair this template with tools like Excel for data imports, ensuring accuracy in representations of economic indicators. Ultimately, this template empowers you to navigate the ever-evolving EU-US landscape with confidence and flair.
Ready to transform your next presentation? Customize this EU-US Relations template today and bridge continents with every slide.
Frequently Asked Questions
How editable are the diagrams in this template?
All 28 diagrams are fully editable, allowing you to change colors, sizes, and data inputs directly in PowerPoint or Google Slides.
Is this template compatible with Google Slides?
Yes, it works seamlessly with Google Slides, ensuring easy collaboration and access across devices.
Can I use this for commercial presentations?
Absolutely, it's designed for professional use, including business and diplomatic contexts, with no restrictions on commercial applications.
What file formats are available?
The template is available in .pptx, .potx, and .jpg formats for versatile use.
How do I incorporate my own data?
Simply select the chart or timeline, input your data via the built-in editor, and watch the visuals update automatically.