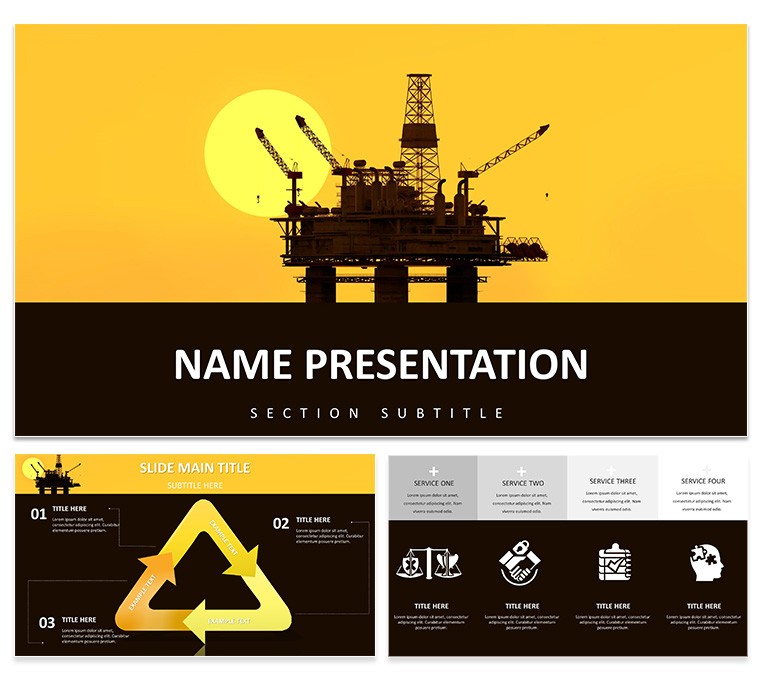
Feel the rumble of offshore platforms and the surge of extracted potential - this Oil Rig PowerPoint template channels that raw force into 28 high-octane diagrams for energy executives, engineers, and project leads. At $22, it's a powerhouse compatible with PowerPoint 2016 and later, converting gritty operational data into galvanizing visuals that drive decisions and deals.
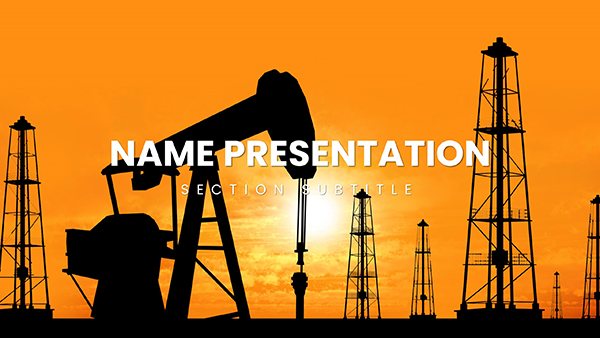
Crafted for those harnessing hydrocarbons, the template's rig silhouettes and pressure-gauge motifs capture industry's unyielding drive. Open with a derrick-framed title that drills down to essentials, then extract value from layouts that pressure-test your pitches. Leave behind bland spreadsheets; fuel forward with designs that resonate with the sector's bold spirit.
Drilling Deep: Features That Extract Maximum Impact
Engineered for endurance, it packs three masters for rig-steady themes, three backgrounds from twilight rigs to dawn drills, and seven color ranges mimicking rust reds to steel grays. Diagrams are depth-rated, primed for seismic inputs or yield forecasts.
- Rig Schematics: Layered blueprints for equipment overviews, dissectible for component spotlights.
- Flow Meters: Pipeline paths with valve icons, adjustable for throughput tales.
- Yield Gauges: Radial dials and bar drills for production metrics, textured for tactile appeal.
Full editability: shapes conform to custom curvatures, charts link to field logs for live lifts.
Field-Tested Applications: Rigs in Play
In project proposals, the Gantt-inspired timeline bores through phases - exploration to extraction - with milestone flares. A site manager leveraged it for funding bids, graphing reserves to reveal untapped veins, securing rigs ahead of schedule.
- Site Your Strategy: Anchor the intro slide with geo-maps, plotting wellheads.
- Sequence Operations: Chain steps on process flows, flagging hazards with caution icons.
- Measure Outputs: Dashboard slides tally barrels, trends arcing like gushers.
- Seal the Deal: Prospect slides with ROI radials, projecting payouts.
Safety briefings harness hazard matrices: color-code risks from seismic shakes to spill scenarios, visuals drilling home preventives. Training modules animate assembly sequences, crew roles clicking into place like tongs.
Operational Overhauls
Reports on uptime use cycle charts - downtime dips as pressure drops, recoveries spiking like strikes. The thematic grit grounds numbers in reality.
Stakeholder Showdowns
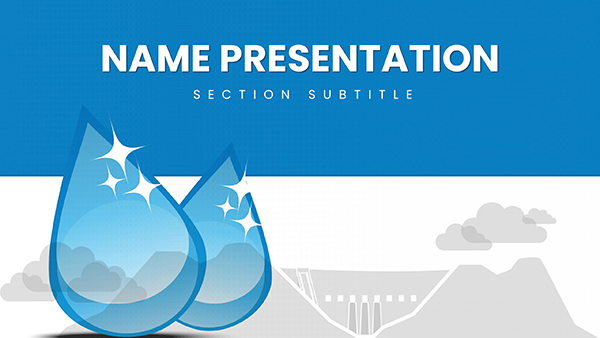
For partners, environmental impact slides balance emissions with offsets, pie segments pressuring for sustainability buys.
Outpacing Plain PowerPoints
Vanilla versions leak engagement like faulty seals; this template pressurizes polish - cohesive palettes prevent patchwork, wipes evoking winch pulls pace reveals. Sync with ERP exports for auto-bore data, or clip rig cams for immersive inserts.
It's torque for tales: matte finishes for printouts, gloss for screens.
Rigorous Routines: Tips to Torque Up
Tune masters to torque specs: weld in hazard symbols as standards. For volumes, stack slides - overview bores, detail dives. Rig for roughnecks; bold fonts weather projections.
Sync teams through tracked changes, revisions like log entries. Lock layers for safety, unyielding to stray edits.
Tap the Oil Rig PowerPoint template for $22 and strike visual gold. Power through, prevail.
Frequently Asked Questions
Industry-specific icons included?
Yes, from pumps to platforms, all scalable for sector precision.
Version compatibility?
From 2016 up, with export options for legacy lifts.
Chart linking capabilities?
Direct to sources like SAP, refreshing yields on demand.
Environmental focus?
Dedicated slides for sustainability metrics and green initiatives.
Animation for processes?
Built-in sequences mimicking extraction flows.