Innovation doesn't whisper; it connects, cascades, and catalyzes. Yet capturing that electric web of ideas in a presentation often feels like herding lightning. Our Innovation Network PowerPoint Template changes that, weaving a tapestry of 28 diagrams that map the unseen threads of progress - from AI ecosystems to supply chain synergies. For visionaries steering startups through uncharted waters or consultants diagramming digital transformations, this template is the spark that turns abstract strategies into tangible triumphs.
With seven color schemes evoking everything from neural networks in silvers to collaborative greens, and editable flowcharts that pulse with potential, it's designed to mirror the dynamic nature of invention. PowerPoint 2016+ compatibility means you can collaborate in real-time, dropping in node data or linkage metrics to reveal patterns that propel decisions.
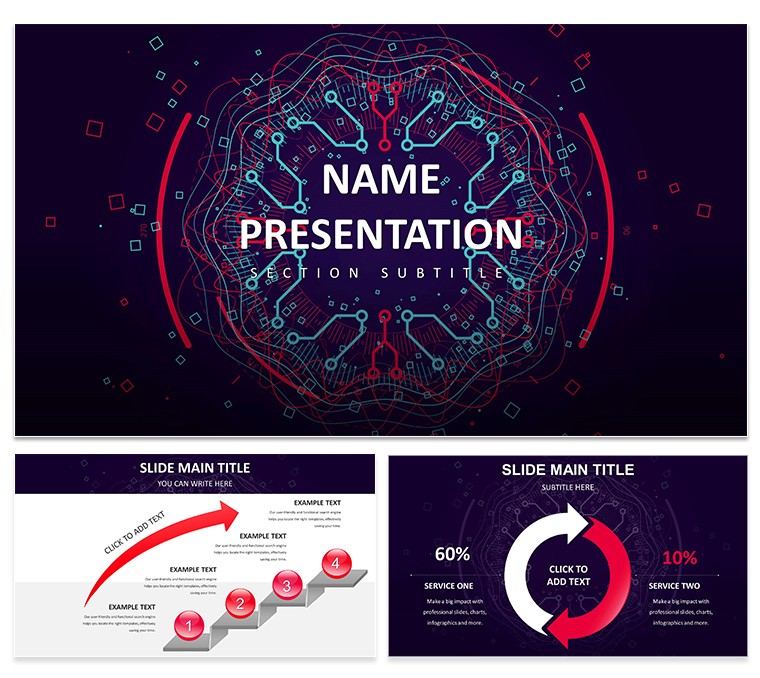
Features Fueling Forward-Thinking Designs
This template pulses with purpose, its components calibrated for the interplay of ideas and execution.
- Network Visuals: Radial diagrams on slide 6 for hub-and-spoke models, scalable to depict global partnerships.
- Infographic Arsenal: 60+ icons - from circuit boards to lightbulbs - for annotating breakthroughs.
- Process Mapping: Gantt-style timelines on slide 14, adjustable for R&D phases or beta rollouts.
- Scheme Spectrum: Seven palettes to match your pitch's energy, from bold reds for disruption to calms blues for integration.
Each element invites exploration, fostering decks that don't just present - they provoke.
Scenarios Where Networks Come Alive
Think of a data scientist at a venture meetup, unveiling an ML pipeline. Populate slide 11's dependency graph with algorithm nodes, link edges with weighted lines via simple drags, and apply the metallic scheme for a tech-forward sheen. As layers unfold, the audience traces the flow from ingestion to inference, sparking investment queries.
For academic panels, a professor might chart interdisciplinary collaborations on slide 19's cluster map, clustering nodes by field and coloring by impact - transforming siloed research into a vibrant web. In corporate strategy, execs use slide 26's impact matrix to score innovation ROI, with heat maps that highlight high-potential intersections.
Streamlined Path to Network Mastery
- Node Injection: Add entities to mind maps on initial slides, auto-connecting via preset rules.
- Edge Enhancement: Customize arrows with labels for causal links, using PowerPoint's connector tools.
- Palette Play: Test schemes on grouped elements to ensure visual hierarchy shines.
- Dynamic Demo: Animate paths to simulate propagation, rehearsing for narrative depth.
This method demystifies complexity, akin to how innovators at xAI diagram emergent behaviors.
Why Networks Need This Edge
Beyond standard slides, the template's Sankey streams on slide 22 trace resource flows in ecosystems, outshining linear lists for sustainability pitches. Entrepreneurs leverage its modularity for pitch decks, embedding live links to prototypes that extend the conversation.
One startup founder adapted it for blockchain overviews, layering transaction graphs to demystify consensus - resulting in seed funding nods.
Connect your vision today. Get the template for $22 and network your way to breakthroughs.
Frequently Asked Questions
How does this template handle complex networks?
With scalable vector diagrams, it supports up to 100 nodes without lag, ideal for intricate AI models.
Are the icons tech-specific?
Yes, including neural nets and APIs, all editable for your niche like IoT or fintech.
Can I animate the connections?
Built-in paths animate sequentially, revealing relationships step-by-step for emphasis.
What about collaboration features?
PowerPoint's co-authoring works seamlessly, perfect for team-built innovation maps.
Is there support for data linking?
Charts connect to external sources like CSV for real-time updates in evolving projects.