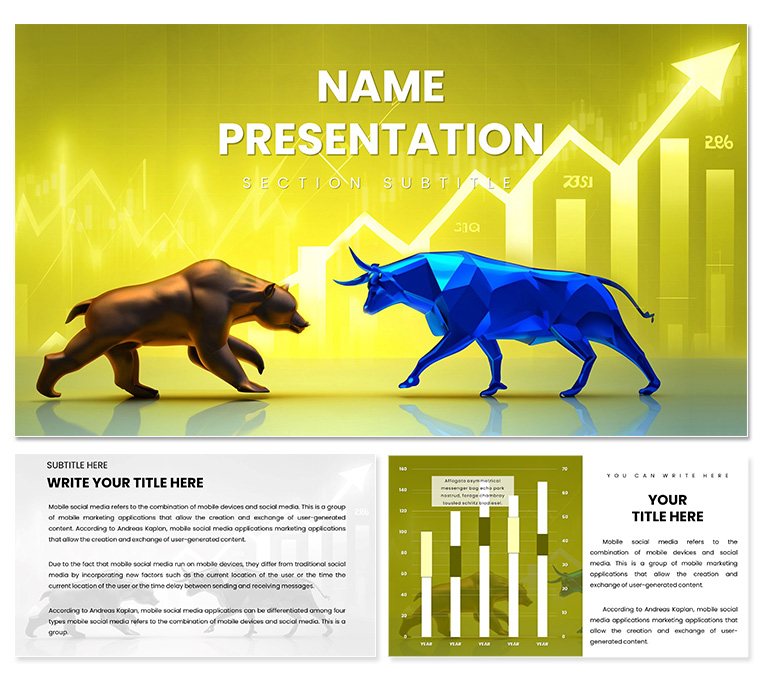
In the high-stakes arena of finance, where every uptick and downturn tells a story, your presentations need to cut through the noise with clarity and conviction. The Bulls and Bears Trend PowerPoint Template is engineered for exactly that - empowering financial analysts, investment advisors, and business strategists to dissect market movements with visual punch. Boasting 28 specialized diagrams, three master slides, and backgrounds that echo trading floor intensity, this template turns dense datasets into digestible insights that drive decisions.
Tired of spreadsheets masquerading as slides? This deck reimagines financial reporting, infusing bull horns for bullish surges and bear claws for cautious retreats. For portfolio managers briefing clients, a volatility heatmap slide can spotlight risk zones, while economists mapping GDP fluctuations find the wave graph ideal for cyclical patterns. It's not just about numbers; it's narrating the market's mood to foster trust and foresight.
Core Components That Chart Your Success
Build your narrative on the three master slides: one for executive summaries with ticker-style headers, another for deep-dive analytics, and a third for scenario planning. These ensure your financial story flows logically, from macro trends to micro tactics.
The 28 diagrams, versatile across seven color schemes - think aggressive reds for bears, optimistic greens for bulls - offer precision tools like candlestick approximations via clustered columns or sector rotations with pie wedges. Each is layered for depth, allowing overlays of forecasts without clutter.
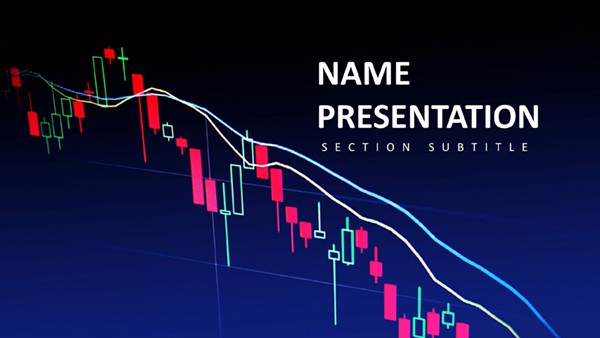
- Dynamic Backgrounds: Three styles, from grid charts evoking Bloomberg terminals to abstract bull-bear silhouettes.
- Trend-Specific Charts: Line series for historicals, funnel diagrams for deal pipelines.
- Symbol-Rich Icons: Stock arrows, currency symbols, all editable vectors.
Seamless in PowerPoint 2021 and Google Slides, with formula-linked charts for live updates. It's your edge in fast-paced boardrooms.
Navigating Key Use Cases in Financial Frontiers
Envision a quarterly earnings call as a hedge fund manager. Open with the summary master, plotting revenue trajectories on a bull-rampant background. Shift to the multi-line trend diagram (slide 5), tracing asset classes over quarters - animate lines to diverge, highlighting outperformance.
For risk assessments, the scatter plot matrix (slide 13) correlates variables like interest rates and equities, with bull/bear icons flagging extremes. In investor pitches, the pyramid forecast (slide 20) stacks probabilities from base assumptions to peak returns, building a case layer by layer.
- Input Your Data: Paste Excel ranges into smart placeholders for instant graphing.
- Refine Aesthetics: Toggle schemes to align with report tones - subdued for bears.
- Simulate Scenarios: Duplicate slides for what-if analyses using the planning master.
- Present Persuasively: Leverage transitions to mimic market pulses, keeping viewers riveted.
An investment banker recently deployed this for a merger analysis, using the balance scale diagram (slide 8) to weigh synergies versus risks. The visual equilibrium tipped decisively in favor, sealing the deal. Over vanilla PowerPoint, it sharpens focus, distilling volatility into vantage points.
Strategic Insights to Bull-Ride Your Decks
Enhance with conditional formatting: Link diagram colors to thresholds, auto-shifting to bearish hues on downturns. For annual reports, the dashboard aggregator (slide 26) consolidates KPIs into a single-view cockpit, complete with gauge meters for liquidity.
Consultants love the SWOT quadrant (slide 1), framing market forces in bull/bear contexts - strengths as charging bulls, threats as lurking bears. Embed pivot tables for interactive drills during Q&A.
Integrate effortlessly: Sync with financial APIs for real-time feeds, or batch-export to interactive PDFs. This keeps your insights current, mirroring market rhythms.
Why Choose Bulls and Bears for Market Mastery
This template transcends templates by embedding financial fluency into every element - diagrams that forecast as fluently as they illustrate. No more abstract axes; expect annotated trends that guide interpretations, like shadow lines for confidence intervals.
For traders, the volume-profile histogram (slide 15) bars trade intensities, crowned with bull peaks. Strategists utilize the decision tree (slide 23), branching investment paths with probabilistic weights.
Charge ahead with market-moving presentations. Download the Bulls and Bears Trend PowerPoint Template for $22 and steer conversations toward success.
Frequently Asked Questions
Supports data imports from Excel?Yes, direct paste or link for dynamic updates.
Editable for custom metrics?Fully - adjust axes, labels, and scales via chart tools.
Compatible with Mac PowerPoint?Yes, cross-platform ready.
Include forecast tools?Built-in trendlines and error bars for projections.
File size considerations?Optimized at under 10MB, even with embeds.
Multi-language text?Yes, fonts support global characters.