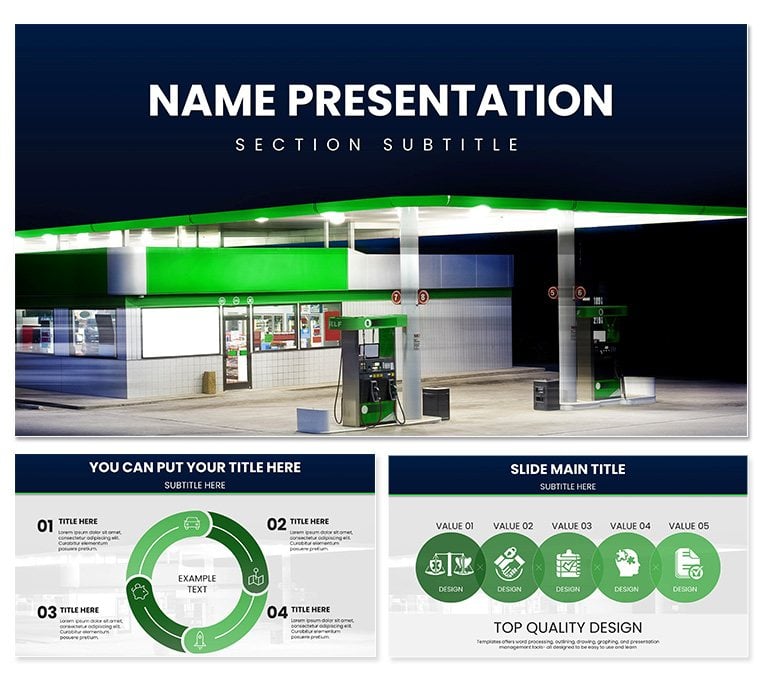
In the fast-paced world of fuel retail, where every margin counts and operations hum like a well-oiled pump, your presentations need to deliver clarity with the punch of a full tank. Enter the Gas Station PowerPoint Template - a powerhouse of 28 diagrams designed to map out everything from inventory flows to customer traffic patterns. Perfect for station owners optimizing daily runs, corporate analysts forecasting trends, or instructors breaking down supply chains, this template turns raw numbers into roadmaps for success.
With three master slides and backgrounds evoking sleek forecourts and dynamic pump icons, you'll navigate complex topics effortlessly. Seven color schemes, from earthy petrol blues to alert safety oranges, let you adapt to boardroom briefs or field trainings. At just $22, it's an investment that pays off in sharper insights and smoother stakeholder buy-in, compatible across PowerPoint versions for seamless sharing.
Fueling Efficiency: Standout Features
This template isn't just slides; it's a toolkit for turning operational chaos into structured stories. The masters provide foundational consistency - think header bars mimicking gauge readouts - while backgrounds layer in subtle textures like asphalt grids for grounded appeal.
- 28 Targeted Diagrams: Specialized visuals like pipeline timelines or pump throughput charts, all primed for your metrics.
- Seven Thematic Schemes: Options such as "Midnight Fuel" for dark-mode reports or "Dawn Shift" for bright, early-morning overviews.
- Integrated Symbols: Dozens of icons from nozzles to tankers, scalable for emphasis without distortion.
Editing flows as naturally as a refuel stop: select a flowchart representing delivery routes, swap data via linked tables, and watch lines reroute automatically. Animations simulate flow dynamics, like liquid moving through hoses, adding a layer of realism that's tough to DIY.
Streamlining Your Edits: A Quick Guide
Launch in PowerPoint, head to slide master for bulk theme tweaks - align fonts to your company sans-serif in one go. For individual tweaks, grab the selection tool on a bar graph styled as fuel level indicators; adjust series colors to match station branding. Import site photos into overlay frames for hybrid data-visual blends.
- Layer compliance checklists as stacked bars, color-coded for quick audits.
- Embed QR codes linking to vendor specs, bridging slides to actionable resources.
- Preview in slideshow mode to fine-tune pacing, ensuring no detail gets lost in the rush.
These steps keep your workflow lean, much like trimming excess in a tight operation.
On the Road to Impact: Practical Applications
Envision a district manager rolling out efficiency upgrades: the Gantt chart, reconfigured as a service lane schedule, timelines tech installs against peak hours, winning over skeptical crews with visual logic. In educational settings, professors use radial diagrams to radiate supply disruptions from global events, helping students trace ripples to local pumps.
For marketing angles, convert scatter plots into loyalty program scatterings - dots as customer visits plotted against rewards redeemed - spotting patterns that drive targeted promos. Safety trainers lean on pyramid structures for hazard hierarchies, apexed with prevention tips, making protocols stick without the drone of text walls.
Sector-Specific Strategies
Owners tackling expansions might sequence phased builds via process maps, each node a milestone from permits to pumps. Consultants could Venn overlapping vendor services, isolating cost savers. Versus stock PowerPoint, this skips generic pitfalls, delivering industry-tuned precision that resonates deeper.
A real edge emerges in hybrid formats: pair with video clips of station cams for live-data demos, transforming reports into immersive reviews.
Revving Up Your Routine: Workflow Wins
Incorporate by outlining sessions first - core ops metrics, then visuals. The template's tabbed navigator speeds to "flow" or "metric" slides. Sync with logistics software exports for auto-updates, keeping decks current amid volatile markets.
Pro move: cap with a dashboard slide aggregating KPIs, like a central console for at-a-glance takeaways. This cements your narrative, propelling decisions forward.
Time to shift your presentations into high gear? Download the Gas Station PowerPoint Template for $22 and steer your stories to standout success.
Frequently Asked Questions
Is this suitable for non-fuel retail operations?
While optimized for gas stations, the diagrams adapt well to similar logistics-heavy sectors like logistics or warehousing.
Can I adjust the color schemes for night-shift reports?
Definitely - each scheme is fully tweakable, with high-contrast options for low-light viewing.
Does it support embedding real-time data from station software?
Yes, placeholders link easily to Excel or API feeds for dynamic updates.
How many custom icons are included?
Over 40 fuel-specific icons, all vector-editable for scaling and recoloring.
What's the file size for quick sharing?
Compact at under 10MB, ensuring fast emails and cloud uploads without compression loss.