 Click to zoom
Gasoline Fuel Pump PowerPoint Presentation Template
| Format | .pptx |
| Slides | 3 unique layouts |
| Aspect ratio | 16:9 |
| Compatibility | PowerPoint |
| Animated | No |
| Language | English |
| License | Commercial |
| File size | — |
| Version | v1.0 |
| Last updated | March 2023 |
What's inside
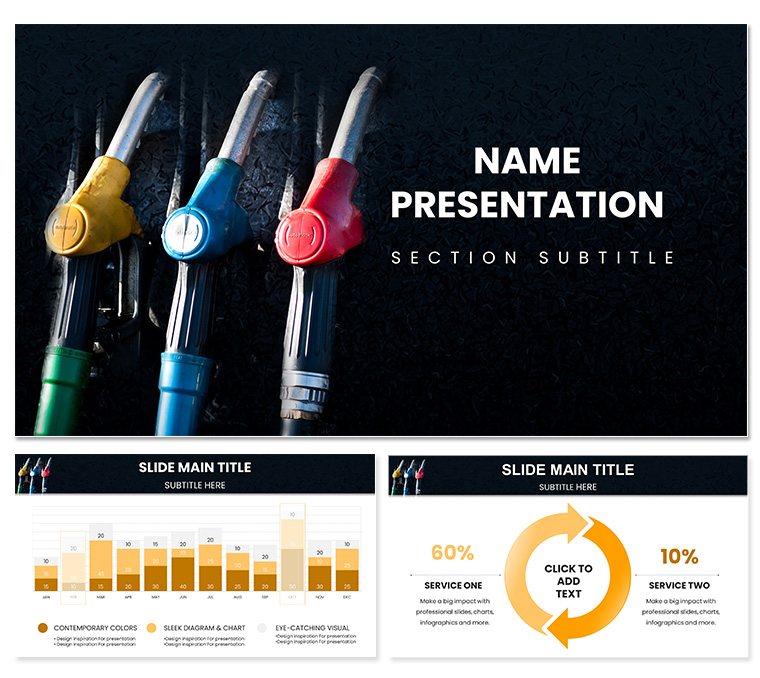
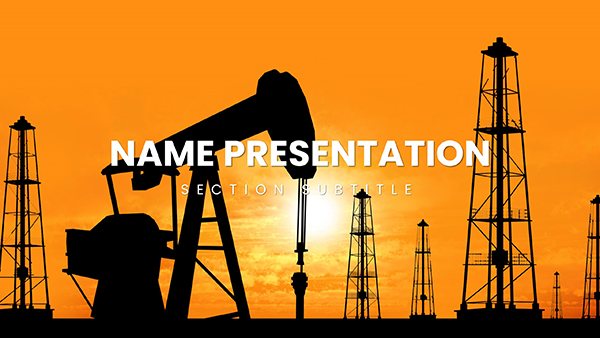
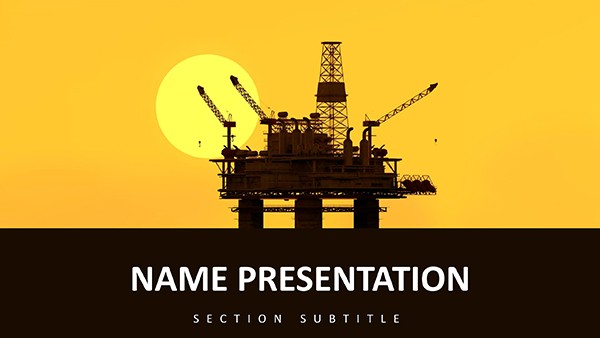
Every click at the pump tells a story of efficiency, demand, and innovation - now channel that rhythm into your presentations with the Gasoline Fuel Pump PowerPoint Template. This collection of 28 diagrams crafts narratives around fuel dynamics, from pump mechanics to market pulses, ideal for energy consultants decoding trends, engineers diagramming systems, or speakers energizing conferences. Three masters and backgrounds draw from industrial motifs like gleaming nozzles and flow meters, grounding your content in authenticity.
Seven color schemes span from high-vis yellows for safety briefs to deep crimsons for performance reviews, all while keeping text legible across devices. For $22, you gain a versatile asset compatible with PowerPoint staples, turning hours of manual charting into minutes of masterful messaging that resonates with stakeholders hungry for clarity.
Pumping Up Precision: Essential Features
Built for the grind of energy discussions, this template's features deliver without the fluff. Masters enforce uniform styling - footers as digital dials tracking slide progress - while backgrounds subtly etch pressure gauge patterns for subtle depth.
- 28 Precision Diagrams: Tailored types like cycle loops for refining processes or radial gauges for volume variances.
- Seven Dynamic Schemes: Choices like "Pressure Peak" for bold accents or "Flow Neutral" for clean analytics.
- Graphic Toolkit: High-res symbols of valves, hoses, and meters, ready to layer into any layout.
Tweaking is intuitive: hover over a line graph emulating fuel lines, input your throughput figures, and curves adjust fluidly. Built-in transitions mimic hydraulic shifts, adding motion that underscores momentum without distracting.
Fine-Tuning the Flow: Edit Essentials
Access via PowerPoint's design tab to overhaul schemes globally - match to corporate palettes effortlessly. On a donut chart circling octane blends, drag segments to reflect blends, with labels auto-updating. Slot in field photos of installations for contextual punch.
- Replicate maintenance schedules as sequential arrows, timing overhauls precisely.
- Hyperlink to regulatory docs, streamlining compliance deep-dives.
- Run accessibility checks to confirm contrasts pop in varied lighting.
Such refinements ensure your deck drives home points with unerring accuracy.
Sparking Connections: Key Use Cases
Consider a refinery lead presenting upgrade proposals: the swimlane diagram partitions phases like parallel pipelines, clarifying handoffs and slashing confusion in Q&A. Classroom facilitators employ tree maps branching emission impacts, rooting lessons in pump-level realities for engaged learners.
Marketers mapping ad ROI use bubble charts as expanding fuel clouds, sizing campaigns by reach and burst. Trainers outline protocol flows in linear paths, each step a valve turn toward safer ops - practical and persuasive.
Industry-Tuned Tactics
For policy wonks, matrix grids compare fuel standards across regions, cells shaded by compliance ease. Versus plain tools, this injects thematic relevance, forging faster comprehension over cookie-cutter clarity.
Enhance with augmented elements: overlay AR previews of pump mods, bridging concepts to tangible trials.
Revitalizing Routines: Seamless Integration
Begin with agenda mapping - priority metrics to visuals. Indexed slides hasten to "gauge" or "cycle" assets. Tie to monitoring apps for live feeds, maintaining decks' pulse with market fluxes.
Insider hack: anchor with an overview infographic fusing core stats, like a master meter for holistic scans. This propels your pitch from informative to influential.
Ready to pressurize your narratives? Snag the Gasoline Fuel Pump PowerPoint Template for $22 and accelerate audience engagement.
Frequently Asked Questions
Does it work for broader energy topics beyond pumps?
Yes, diagrams flex to renewables or grids, with adaptable motifs.
Are graphics scalable for large-format prints?
All vectors ensure sharpness at any size, from screens to posters.
Can I add custom animations for demo effects?
Base ones exist, but PowerPoint's library integrates for bespoke sequences.
How editable are the text placeholders?
Fully - fonts, sizes, and alignments shift to suit your voice.
Is it optimized for team collaboration?
Cloud-friendly formats enable real-time edits in shared drives.
Good for
- Project roadmaps and sprint plans
- Product launch timelines
- Quarterly or annual review decks
- Company history and milestone summaries
Licence
reviews
Used for a sales territory map, the region outlines are decent.
The pins are a bit low-res but i replaced.
Good for a basic geographic analysis.
The colors are standard, nothing special.
Took a few minutes to customize but fine.
FAQ
Will it work in Google Slides?
Are fonts embedded?
Can I use this for client work?
What's the refund policy?
Do you update the template after purchase?
Similar templates
See all PowerPoint Templates →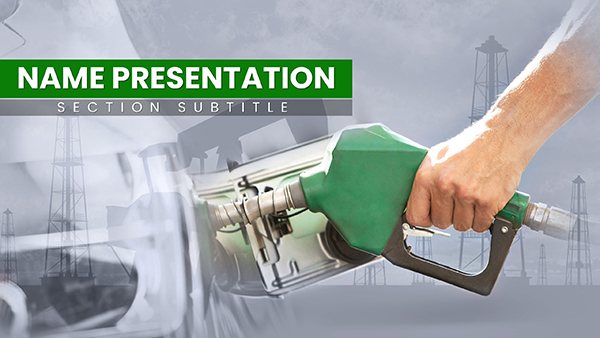
All 1 slides