 Click to zoom
Data Info PowerPoint Template: Web Business Slides
| Format | .pptx |
| Slides | 3 unique layouts |
| Aspect ratio | 16:9 |
| Compatibility | PowerPoint |
| Animated | No |
| Language | English |
| License | Commercial |
| File size | — |
| Version | v1.0 |
| Last updated | January 2023 |
What's inside
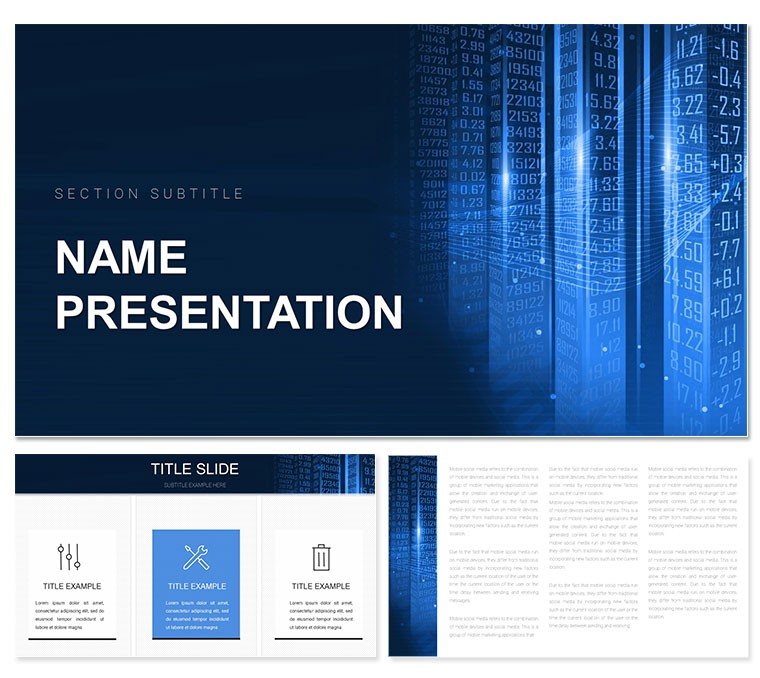
Web development doesn't sell itself - your presentations do, weaving data into narratives that convert skeptics to clients. The Data Information PowerPoint template steps up for digital marketers, e-commerce managers, and IT consultants, delivering a polished arsenal in familiar PowerPoint format. With 28 diagrams, three masters, and three backgrounds, it's engineered to spotlight analytics, user flows, and ROI projections without the design grind.
Envision dashboards that pulse with site traffic insights or infographics decoding conversion funnels - all infused with web-themed aesthetics like circuit patterns or node networks. Seven color schemes, from digital neons to enterprise grays, ensure your deck vibes with startup energy or corporate restraint, making complex metrics memorable.
Standout Features Tailored for Digital Decks
Rooted in PowerPoint's robust ecosystem, this template handles everything from Office 365 collaborations to standalone exports. Three masters guide your structure: a hero slide for overviews, a detailed pane for metrics, and a canvas for brainstorming sessions. Backgrounds nod to the digital realm - a wireframe grid, a flowing data stream, or a subtle pixel mosaic - all vector-sharp for any resolution.
The 28 diagrams are the stars: heat maps revealing user engagement hotspots, or tree diagrams branching e-commerce categories. Web icons - browsers, carts, APIs - top 50, dropping in to annotate without fanfare. Paste CSV exports directly into charts for instant visualization.
- Diagram Range: Encompasses A/B test comparisons, SEO audits, and backend architectures.
- Color Versatility: Seven palettes, optimized for screen shares and prints alike.
- Motion Magic: PowerPoint morphs for seamless transitions between data states.
Customization clicks: theme fonts for modern readability, shape fills for branding, or entrance effects to stage reveals. It eclipses stock templates by prioritizing data integrity over decoration.
Strategic Applications in Web and Business Worlds
E-commerce leads demoing platform upgrades use pyramid diagrams to stack features by impact, apexing on revenue lifts. A web agency principal recounted using akin visuals to secure a redesign gig, funnel slides clarifying UX pain points.
For business promotions, SWOT matrices frame market entries, quadrants populated with competitor intel. IT pitches thrive on sequence diagrams for app integrations, arrows syncing with deployment phases.
In stakeholder updates, radial gauges track KPIs like bounce rates, needles pivoting to targets.
Blueprint for Your Web-Focused Presentation
- Master Selection: Grab the metrics master, overlay a wireframe background for tech cred.
- Diagram Deployment: Slot a heat map; bind to spreadsheet for live refreshes.
- Color Calibration: Pick neon for innovation slides, auditing for visibility.
- Effect Enhancement: Apply fades to unroll user journeys progressively.
- Delivery Prep: Run slide sorter, package as .pptx for cross-platform sends.
This method amplifies efficiency, trumping from-scratch builds with ready rigor.
Propel Your Digital Dialogues Forward
Its secret sauce? Adaptive layouts that flex with evolving web trends, plus co-authoring for agile teams. In the data deluge, it distills essence, empowering pitches that close deals.
Scoop up the Data Information PowerPoint template for $22 and code your success - slide by strategic slide.
Frequently Asked Questions
Which PowerPoint versions support this?
Works with PowerPoint 2016+, including Microsoft 365 for cloud syncing.
Are diagrams web-data friendly?
Indeed, with import slots for Google Analytics or similar exports.
Suitable for e-commerce pitches?
Spot-on, with funnels and carts geared for sales narratives.
How many icons for digital themes?
Over 50, covering UI elements to cloud services.
Export options for non-PowerPoint users?
Yes, to PDF or video, preserving interactions where possible.
Good for
- Project roadmaps and sprint plans
- Product launch timelines
- Quarterly or annual review decks
- Company history and milestone summaries
Licence
reviews
Those AI/ML charts are great for model performance decks.
The accuracy vs recall graph is clear.
Used the confusion matrix template for a presentation.
Nice, the feature importance bar chart is well designed.
The training loss curve is standard but fine.
FAQ
Will it work in Google Slides?
Are fonts embedded?
Can I use this for client work?
What's the refund policy?
Do you update the template after purchase?
Similar templates
See all PowerPoint Templates →


All 1 slides