 Click to zoom
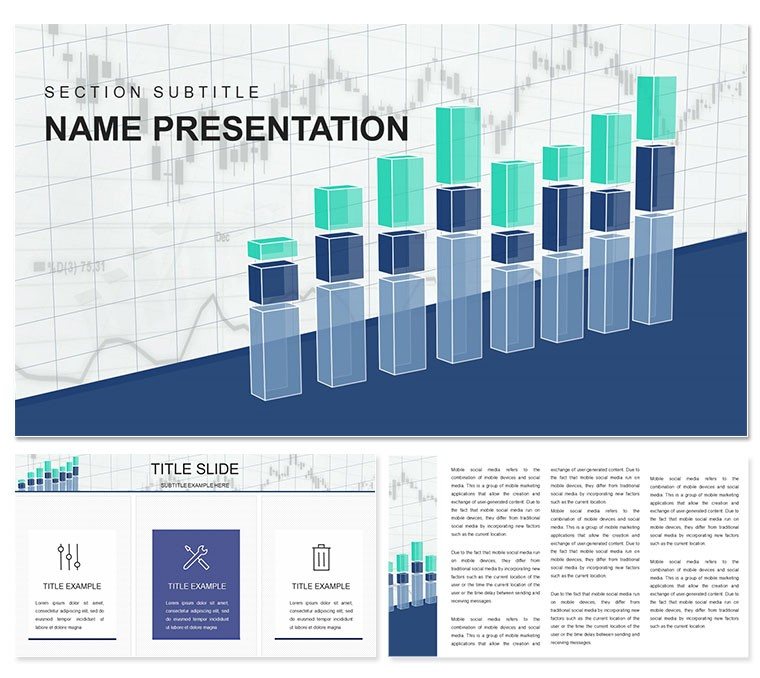
Financial Statement Analysis PowerPoint Template
| Format | .pptx |
| Slides | 3 unique layouts |
| Aspect ratio | 16:9 |
| Compatibility | PowerPoint |
| Animated | No |
| Language | English |
| License | Commercial |
| File size | — |
| Version | v1.0 |
| Last updated | October 2022 |
What's inside
Unlock the narrative hidden in numbers, where balance sheets tell tales of resilience and income statements chart paths to profitability. The Financial Statement Analysis PowerPoint template arms accountants, CFOs, and analysts with 28 incisive diagrams to unravel fiscal intricacies, turning dense ledgers into digestible insights that drive decisions.
Precision-engineered for PowerPoint 2016+, it honors your analytical rigor with swift customizations. Seven color schemes - from conservative navies for audits to optimistic greens for forecasts - complement three masters, forging reports that resonate from boardrooms to briefings.
Premier Features for Fiscal Clarity
Diagrams like DuPont breakdowns and Z-score models feature calibrated axes and legend keys, icons of calculators and trends adding contextual punch.
- Refined Tweaks: Recast ratios or resize pie segments with surgical ease.
- Insightful Sequences: Animate variance analyses to spotlight deviations dynamically.
- Expanded Capabilities: Incorporate ERP exports or voiceover audits fluidly.
- Unified Themes: Three backgrounds ground your data, from ledger lines to growth arcs.
Versatile in .pptx, .potx, and .jpg, it's set for stakeholder distributions or compliance archives.
Proven Contexts: Audits to Advisory
An audit partner leverages slide 19's liquidity ratios to flag covenant risks, mirroring FASB standards. In quarterly earnings calls, diagram 13's EVA trees root value creation, guiding analyst Q&As.
For advisory firms, the template's scenario planners model M&A impacts, while solopreneurs track solopreneur cash flows for tax prep. It adapts to nonprofit reviews, visualizing fund allocations transparently.
- Match Your Mode: Opt for palettes signaling stability or surge.
- Populate Precisely: Link QuickBooks figures for auto-populated trends.
- Highlight Anomalies: Call out red flags with conditional formatting cues.
- Time Transitions: Pace reveals to align with explanatory beats.
- Advise Actionably: Conclude with prescriptive visuals for next steps.
This protocol sharpens focus, eclipsing manual mocks with methodical might.
Emblematic Diagram Details
Slide 26's common-size statements normalize lines for cross-firm comps. Diagram 8's Treynor ratios benchmark portfolios, essential for asset allocation debates.
Distinction in Financial Visualization
It leads with fiscal finesse - backgrounds evoking tickers, seven schemes for sentiment syncing, three variants for format flexibility, from PDFs to projections.
Advanced: Tie to Bloomberg APIs for embedded feeds, evolving statics to strategics.
Balance your books brilliantly - claim the Financial Statement Analysis PowerPoint template for $22 and analyze ahead.
Frequently Asked Questions
Compatible with accounting software?
Yes, imports from Excel or Xero for seamless data flow.
Can it handle multi-year comparisons?
Absolutely, with expandable timelines for longitudinal views.
Are GAAP/IFRS elements included?
Core ratios align; customize footnotes for standards.
How secure for sensitive data?
Standard PowerPoint protections apply; use password features.
Suitable for beginners?
Yes, with intuitive labels guiding novice navigations.
Export options for print?
High-res .jpgs ensure sharp handouts or binders.
Good for
- Project roadmaps and sprint plans
- Product launch timelines
- Quarterly or annual review decks
- Company history and milestone summaries
Licence
reviews
Those scenario planning templates are good for uncertainty.
The axes for different futures were clear.
A bit advanced but valuable.
The implications for each scenario were key.
FAQ
Will it work in Google Slides?
Are fonts embedded?
Can I use this for client work?
What's the refund policy?
Do you update the template after purchase?
Similar templates
See all PowerPoint Templates →


All 1 slides