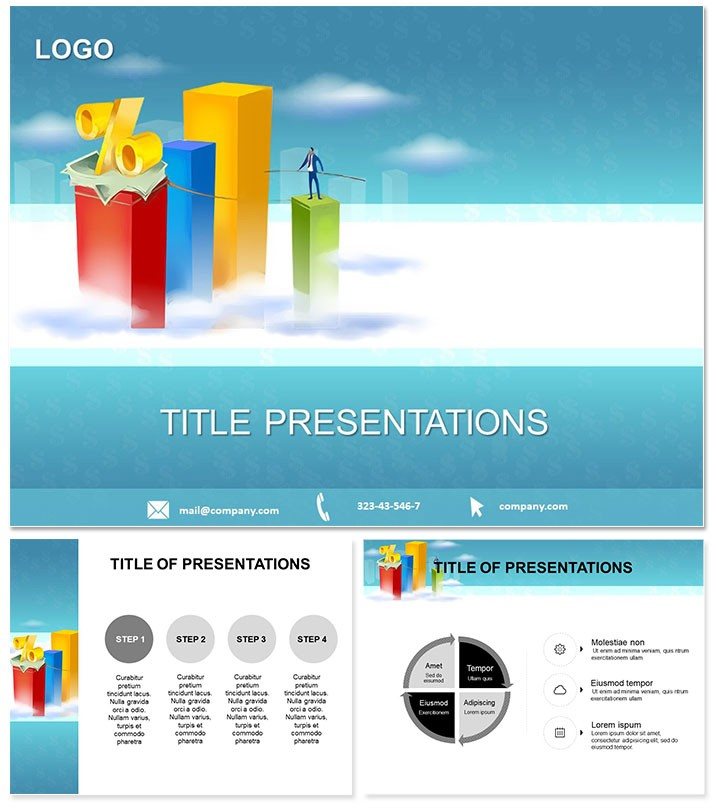
Unveil patterns in your data streams with the Analysis Activity Keynote template, a beacon for those decoding daily dynamics into decisive insights. Tailored for analysts, educators, and self-trackers, it distills progress metrics into pristine visuals that propel informed choices and growth narratives. Say goodbye to scattered spreadsheets; hello to streamlined stories that spotlight successes and strategies.
Keynote 2016+-ready, it equips three masters, three backgrounds, and 28 diagrams via seven color schemes for nuanced palettes. Pre-built for trends, recommendations, and overviews, its simplicity saves savvy users hours weekly. Coaches commend it for goal-setting clarity, fostering focus amid flux. It`s your analytical accelerator, blending brains with beauty.
Spot a manager monitoring KPIs: trend lines trace quarterly climbs, guiding tweaks. Or a fitness buff charting workouts, with bars benchmarking gains. This template`s prowess? It anticipates queries, layering answers accessibly. Beyond bland bases - integrate it today and illuminate paths.
Precision Features for Probing
Probe 28 diagrams, primed for 16:9 scrutiny.
- Insight Diagrams: Trend spotters, progress pies, rec charts for depth.
- Swift Shifts: Data drops update wholes holistically.
- Backdrop Basics: Three, from crisp to contextual.
- Hue Horizons: Seven, analytical to artistic.
Boardrooms beam with its brevity, boosting buy-ins briskly.
Analytical Arenas
Execs employ for efficacy evals, educators for enrichment evals, students for self evals. Consultants craft case closes, closing loops lucidly.
Keynote kernels kernel out; this knits narratives neatly. A data diva detailed dashboard delights, delighting directors. Crucial for cohorts, coalescing contributions.
Surpassing Stock Scans
Standard scans skim surfaces; this delves deeply, dynamically. Stocks stutter on stacks; these stack seamlessly, scaling sharp.
Amplify Your Analytics
Perpetual prowess per purchase; procure promptly for peak probing.
Frequently Asked Questions
Prime for analysis what?
Progress probes, trend traces for pros.
Keynote kinship?
2016+, kindred across kits.
Diagram duplications?
Duplicate 28 for bespoke bites.
Color counts?
Seven, shade-shifting savvy.
Formats?
.key, .kth, .jpg archived.
Masters?
Three, motif-molding mains.