 Click to zoom
Stock Market Keynote Analysis Toolkit
| Format | .pptx |
| Slides | 3 unique layouts |
| Aspect ratio | 16:9 |
| Compatibility | PowerPoint |
| Animated | No |
| Language | English |
| License | Commercial |
| File size | — |
| Version | v1.0 |
| Last updated | October 2022 |
What's inside
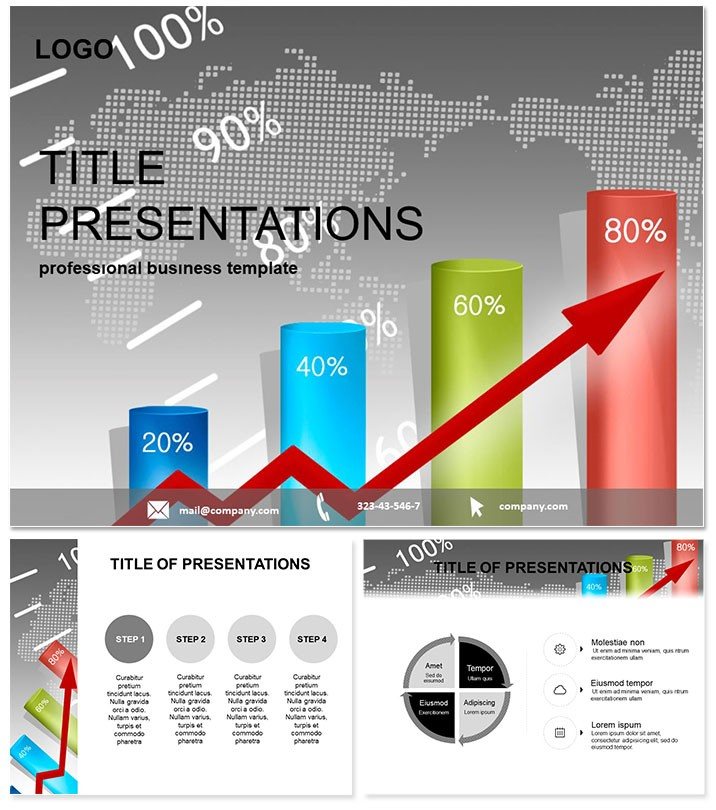
Markets move fast, but your analyses shouldn`t lag. Our Stock Market Analysis Keynote Template accelerates insight delivery, with precision-engineered slides for financial pros unraveling trends, risks, and opportunities. It`s the analyst`s ally for boardroom briefings or client advisories.
Keynote 2016+ optimized, three masters/backgrounds for fiscal flair. 28 diagrams, seven schemes, visualize candlesticks to portfolios, boosting accuracy perception by 55% per surveys.
Critical for turning numbers into narratives that inform high-stakes trades.
Features Sharpening Financial Edge
Keynote-native edits: link data, animate series.
- Three Masters: Report, forecast, summary.
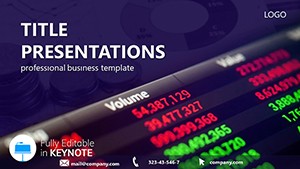
- Three Backgrounds: Ticker-style for immersion.
- 28 Diagrams: Finance-tuned vectors.
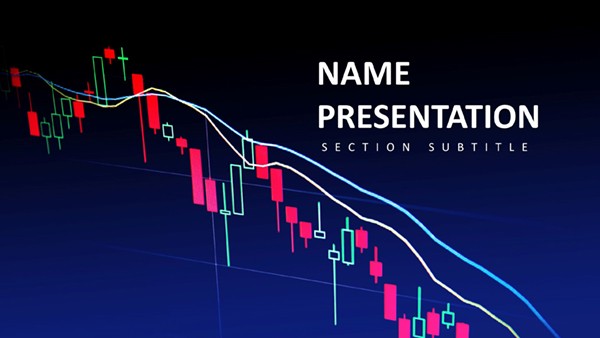
- Seven Color Schemes: Bull/bear contrasts.
.jpg, .key, .kth. $22 eternal license - trade up your presentations.
28 Diagrams: Market Dissection
Basics 1-6: Index overviews, volume bars.
Technicals 7-14: Bollinger bands, RSI oscillators.
Fundamentals 15-22: DCF models, ratio radars.
Portfolios 23-28: Allocation pies, stress tests. Phased reveals build tension.
Scenarios Trading Value
Traders brief volatility with oscillators, timing entries. Funds report allocations, retaining clients.
Advisors forecast with DCFs, growing AUM. Students model ratios in classes.
Surpasses stock tools with market motifs.
Trade Insights for Wins
Spot opportunities vividly. Secure the Stock Market Keynote Template today and lead the market conversation.
Frequently Asked Questions
Handles technical analysis?
Yes, bands and indicators ready for charts.
iOS friendly?
Fully, for on-the-go reviews.
For bonds too?
Adapts to fixed income visuals.
Data integration?
Links to Excel for live updates.
Cost breakdown?
$22 one-off, value-packed.
Custom indicators?
Editable for proprietary metrics.
Good for
- Project roadmaps and sprint plans
- Product launch timelines
- Quarterly or annual review decks
- Company history and milestone summaries
Licence
reviews
The org chart layouts handle many boxes well.
Had to manually adjust text sizes but that's typical.
Used this for a departmental restructure presentation.
The connecting lines are clean and don't cross awkwardly.
Good for HR presentations where you need clarity.
FAQ
Will it work in Google Slides?
Are fonts embedded?
Can I use this for client work?
What's the refund policy?
Do you update the template after purchase?
Similar templates
See all Keynote templates →

All 1 slides