Financial Market Analysis Keynote Template: Free Insights
What's inside the paid version? 28 diagrams with 7 color schemes for financial decks.
No setup needed.
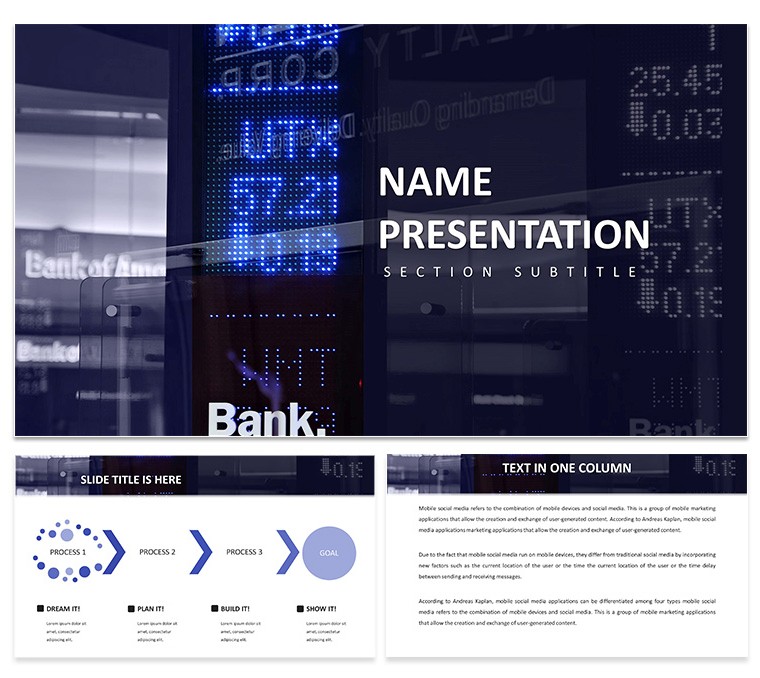
When you need to show market trends and analysis to investors the diagrams provide the exact structure and replace manual drawing in Keynote while keeping the layout readable on one slide.
Analysts use this file to present quarterly insights without spending time on alignment.
The diagrams use a grid structure with color-coded sections to distinguish steps in your market explanation.
Color changes happen through the slide master.
The page does not list the exact Keynote version but the files follow standard KEY/KTH formats compatible with current installations.
Use this instead of building diagrams manually in Keynote.
The predefined structure keeps everything aligned so you don't end up adjusting spacing slide by slide.
Best used when your focus is structured process explanation.
It is not ideal for data-heavy dashboards with multiple charts.
You can duplicate slides and reuse the same structure across multiple reports.
| Feature | Details |
|---|
| Slides / diagrams | 28 diagrams themed for financial analysis |
| File format | KEY, KTH |
| Software version | Keynote 12+ |
| Color schemes | 7 schemes switch via master slide |
| Editable elements | Text icons colors resize independently |
| Aspect ratio | 16:9 |
| Free vs Paid | Full set of 28 diagrams in paid version |
| Masters / Backgrounds | Master slides for instant palette changes |
In most cases you only replace text and adjust colors.
No complex layouts just structured blocks.
Download and start editing immediately
Is it compatible with Keynote 12 and later on macOS?
The template works with Keynote 12 and newer versions on macOS 11 or higher. Open the KEY file directly. In most cases no conversion is required.
Can I use this template for client work?
Yes the license allows commercial use for your own or client presentations. One license per user. Do not resell the template itself.
What is the difference between free and paid?
The page does not specify free vs paid differences. The paid version provides the complete set of 28 diagrams and 7 color schemes. No free version details are listed on the page.
What are the refund conditions?
Refunds are available within 14 days if the template does not meet your needs. Contact support with your order number. No refunds after the file has been downloaded and used.
Can multiple team members use one license?
One license covers one user. Each team member needs their own license. Contact for team pricing options.
Excel Financial Growth Analysis Keynote Template Presentation Audit Financial Statements Keynote Template: Precision in Every Ledger