Feel the pulse of worldwide change in every slide, where data streams converge like rivers into an ocean of opportunity. The Global Impact: Data-Driven Keynote Template is engineered for consultants, e-commerce strategists, and business visionaries who must demonstrate far-reaching effects - from supply chain ripples to customer sentiment waves. This template elevates standard reports into instruments of influence, helping you articulate how initiatives cascade across markets and metrics.
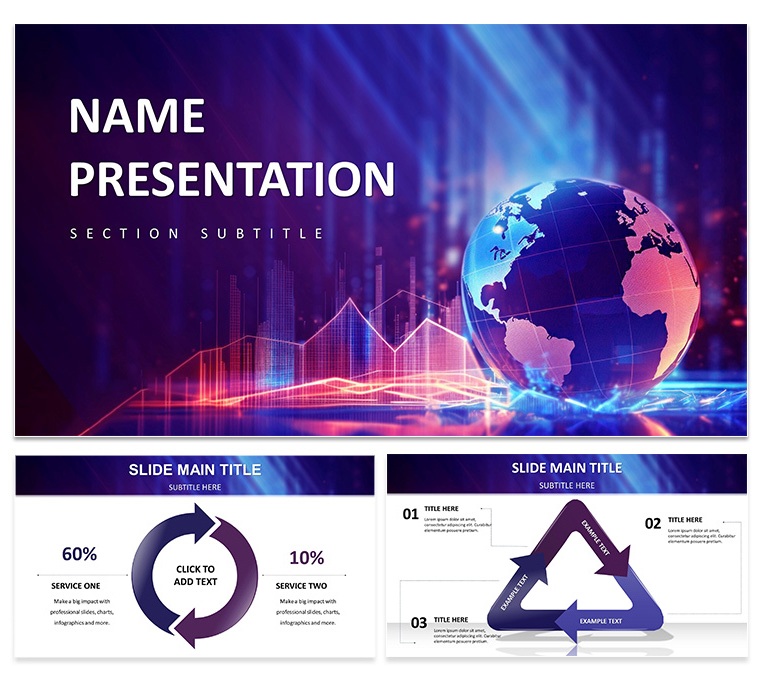
Encompassing 59 adaptable slides via three masters and three evocative backgrounds, it deploys 28 infographic-rich diagrams across seven impact-focused color schemes, ranging from decisive reds for urgency alerts to serene aquas for collaborative gains. Tailored for Keynote 2016+, it harmonizes with your toolkit, accelerating from concept to compelling delivery for scenarios like e-commerce scalability audits.
Imagine a consulting partner, echoing McKinsey's global diagnostics, harnessing these layouts to trace a client's digital transformation footprint. The flagship slide, with its orbiting globe threaded by data arcs, encapsulates interconnectedness, priming viewers for revelations in sustainability indices or revenue dispersions.
Driving Impact Through Interactive Design
Interactivity defines this data-driven Keynote template, turning passive viewing into participatory exploration. Flexible layouts accommodate diverse formats, from dense dashboards to narrative arcs, with clickable zones that expand sections on demand - perfect for branching into regional case deep-dives.
Infographics lead: Sankey flows channel resource allocations across borders, while bubble clusters size opportunities by influence potential. Seven schemes ensure thematic fit, with high-saturation options for e-commerce dashboards or desaturated for consulting briefs.
- Animated Transitions: Globe spins to unveil phased impacts, syncing with your cadence for rhythmic reveals.
- Icon-Linked Hotspots: Tap metrics icons to popup supporting visuals, enhancing live or recorded sessions.
- Modular Grids: Snap-together blocks for custom impact matrices, balancing text and viz ratios intuitively.
Consistent elements like branded watermarks and scalable vectors maintain polish, while color-coding guides eyes through complexity, as in e-commerce funnels segmented by fulfillment zones.
Assembling Influence: Step-by-Step Blueprint
- Anchor the Theme: Align master to your impact angle - strategic for overviews, tactical for metrics.
- Embed Dynamics: Populate infographics with API-fed data, auto-scaling axes for proportional truths.
- Infuse Interactivity: Wire hyperlinks to appendices, creating choose-your-adventure flows for engaged queries.
- Refine Resonance: Calibrate animations to narrative beats, testing for timing in rehearsal mode.
- Amplify Access: Generate accessible PDFs with tagged elements for inclusive sharing.
This blueprint mirrors strategies in Bain's impact frameworks, yielding presentations that catalyze commitments over mere consensus.
Strategic Applications for Global Changemakers
Deploy across fronts: an e-commerce director arrays conversion cascades in waterfall charts, cascading from traffic sources to lifetime values by locale. Consultants layer SWOT globes, orbiting strengths around threat terrains for holistic advisories.
For finance integrations, treemaps partition budgets by global arms, pruning branches for efficiency spotlights. Outshining basic builds, it packs 55+ interactive icons - from gears for processes to leaves for eco-impacts - plus responsive animations that adapt to slide durations.
Visualize a strategist for a retail giant: they construct a radar overlay for competitor footprints, beaming signals of market penetrations to spotlight invasion points. The payoff? Decks that don't just report - they rally.
Tactics for Amplified Engagement
Heighten draw by varying viz types per section - mix flows with clusters to sustain curiosity - and anchor with bold headers that tease takeaways. Employ Verdana for versatile readability, and tether to CRM exports for pulsing pipeline visuals.
Launch Lasting Global Waves
When impact demands illustration, this Data-Driven Global Impact Keynote Template delivers the depth to make waves. It's for leaders who see data as the thread weaving worldwide progress.
Launch your legacy: acquire this transformative template for $22 and set impacts in motion.
Frequently Asked Questions
Are interactive elements mobile-friendly?
Yes, touch-optimized hotspots and scalable vectors ensure seamless interaction on iPads or laptops.
How many infographics are there?
28 dedicated ones, spanning flows, maps, and matrices for comprehensive impact coverage.
Can I integrate live data?
Certainly - link to web sources or sheets for charts that refresh on open, keeping content current.
What themes do the color schemes cover?
From urgent reds for risks to harmonious blues for synergies, matching consulting to e-commerce vibes.
Is it suitable for team collaborations?
Yes, with shared editing via iCloud, allowing real-time tweaks by distributed global teams.
How editable are the animations?
Highly - adjust durations, sequences, and triggers in Keynote's inspector for custom dynamism.
-

Global Financial Economics Keynote Template: Presentations
$12.00
•
KEY, KTH
★ 4 (192)
-
Data-Driven Growth Keynote Template
$8.00
•
JPG, KEY, KTH
★ 3 (126)
-

Global Economic Crisis Keynote Template: Navigate Turbulent Markets
$10.00
•
JPG, KEY, KTH
★ 2 (562)
-

Unified Solutions Keynote Template
$8.00
•
JPG, KEY, KTH
★ 3 (310)
-

Justice & Global Governance Diagrams - Editable Keynote | ImagineLayout
$10.00
•
KEY, KTH
★ 5 (8)
-

Problems, Crisis, Salvation, Search Ideas Keynote Templates
$12.00
•
KEY, KTH
★ 3 (1053)
-
Finance: Dollar Decline or Dollar Collapse Keynote template
$12.00
•
KEY, KTH
★ 4 (384)
-

Global Innovation Venture Keynote Template
$10.00
•
JPG, KEY, KTH
★ 4 (160)
See more in Business - Global Keynote Theme →