In the high-stakes world of energy, where every barrel counts, clarity isn`t optional - it`s essential. The Oil & Gas Extraction Keynote Template equips upstream executives and field engineers with 28 precision-engineered diagrams to decode complex processes, from seismic surveys to refinery outputs. It`s your bridge from raw data to riveting boardroom narratives, blending technical depth with visual polish.
Targeted at downstream analysts and joint venture teams, this tool shines in live sessions on macOS or iPadOS, where drag-drop updates keep metrics fresh. Seven color schemes - deep blues for subsea ops, fiery oranges for processing - ensure brand alignment, while over 50 icons (rigs, valves) add authenticity. Amid 2025`s volatile markets, where extraction efficiencies could save billions, this template turns numbers into narratives that command attention.
Users in the sector praise its modularity: One geologist slashed prep time by 50%, focusing on strategy over styling. Compatible with Keynote 2016+, it`s scalable for global teams, exporting seamlessly to PDFs for remote shares.
Key Features: Engineering Excellence in Every Slide
Crafted for pros who demand reliability, this template leverages Keynote`s strengths with energy-specific innovations. Highlights include:
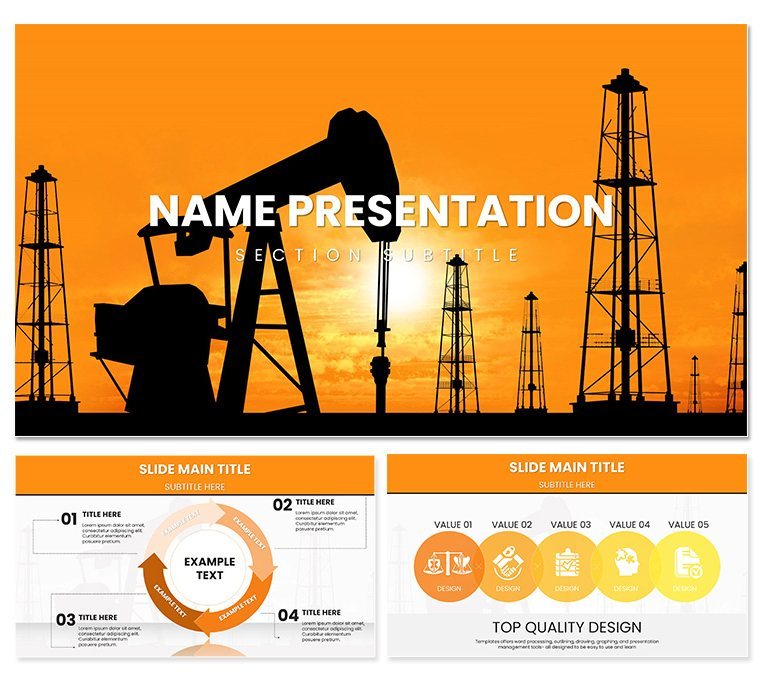
- 28 Specialized Diagrams: Flowcharts trace extraction cycles, bar graphs compare reserves, line charts track efficiencies.
- Three Master Layouts: Title slides for intros, overviews for tech dives, summaries for exec overviews - maintaining flow.
- Three Background Options: Grids for data-heavy slides, earth tones for realism, whites for clarity.
- Seven Thematic Colors: Adaptable palettes for ops moods, with global edits for quick rebrands.
- 50+ Editable Icons: Vector-based drill bits and pipelines, recolorable and repositionable for custom fits.
Animations reveal data sequentially, placeholders slot in jargon like "bbl/d," and vector scalability ensures crisp prints or zooms.
Slide Structure: Mapping Your Energy Story
Begin with an executive title grounding viewers in "Fueling Tomorrow`s Insights," then layer geological data via pyramid structures. Core slides use infographics: Timelines for project phases, radial charts for risk assessments, scatter plots correlating yields to depths.
Midway, bottleneck highlights employ funnel diagrams, while success stories shine in before-after comparisons. Conclude with projections - Gantt charts for ventures - leaving audiences energized. At 40+ slides potential, it`s flexible for concise reports or deep dives.
Use Cases Across the Energy Spectrum
Upstream Exploration and Field Reports
Engineers visualize seismic data in layered maps, impressing stakeholders with animated reveals. In field ops, iPad compatibility enables on-site tweaks, boosting real-time decisions.
Downstream Refining and Logistics
Analysts chart throughput with line graphs, forecasting disruptions - vital as global demand hits 100M bbl/d in 2025.
Joint Ventures and Investor Pitches
Teams blend data from partners using modular grids, with ROI timelines sealing funding rounds. One JV lead credited a 20% faster close to these visuals.
Research and Regulatory Presentations
Academics or compliance pros use comparison tables for ESG metrics, ensuring transparent, data-backed compliance.
Superior to Stock: A Side-by-Side
| Element | Standard Keynote | Oil & Gas Template |
|---|
| Industry Icons | None specialized | 50+ tailored vectors for rigs and flows |
| Data Integration | Manual charting | Pre-built with placeholders for metrics |
| Mobile Editing | Basic sync | Drag-drop on iPad for live field use |
| Visual Scalability | Potential pixelation | Full vector for any output size |
Step up your game - download instantly to fuel presentations that ignite action.
Frequently Asked Questions
Compatible with older Keynote versions? Yes, from 2016+ on macOS/iPadOS.
Can I animate extraction flows? Built-in support for sequential reveals on diagrams.
How many slides included? 28 core diagrams, expandable to 40+.
Editable for custom data? Fully, with slots for reserves, yields, and projections.
Licensing for teams? One-time buy for unlimited internal use.