 Click to zoom
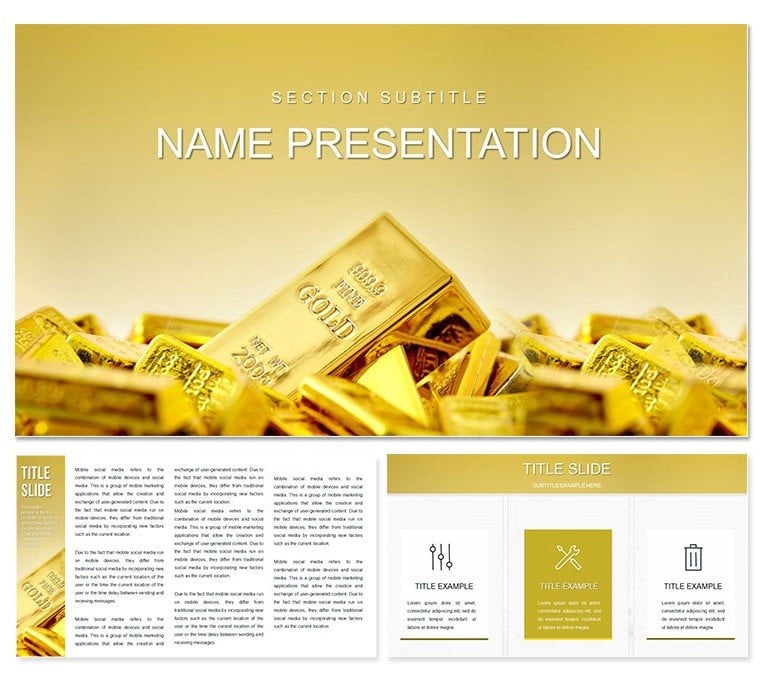
Gold Price Chart Keynote Template: Professional Designs for Impactful Financial Presentations
| Format | .pptx |
| Slides | 3 unique layouts |
| Aspect ratio | 16:9 |
| Compatibility | PowerPoint |
| Animated | No |
| Language | English |
| License | Commercial |
| File size | — |
| Version | v1.0 |
| Last updated | June 2023 |
What's inside
Imagine stepping into a boardroom where your slides don't just show numbers - they tell a story of market shifts, investment opportunities, and strategic foresight. That's the power of our Gold Price Chart Keynote Template, crafted specifically for financial professionals who need to turn complex gold market data into clear, persuasive visuals. Whether you're a seasoned analyst breaking down historical trends or an investor pitching the next big opportunity based on live spot rates, this template equips you with 28 meticulously designed diagrams across three master slides and backgrounds. With seven versatile color schemes, you can align every chart and infographic to your brand's palette, ensuring your presentation resonates with precision and polish.
At its core, this Keynote template simplifies the chaos of gold price fluctuations. Picture a sleek line graph tracing the rise and fall of spot prices over the past decade, overlaid with key economic events like inflation spikes or geopolitical tensions - all editable in minutes. Or envision a dynamic pie chart dissecting global supply sources, from mining giants in South Africa to recycling streams in Europe. These aren't generic placeholders; they're tailored for the nuances of precious metals markets, helping you highlight volatility patterns that could sway stakeholder decisions. For business leaders in commodities trading, this means crafting reports that not only inform but inspire action, like reallocating portfolios during bullish runs.
Key Features That Set Your Financial Slides Apart
Why settle for bland spreadsheets when you can deploy ready-to-use visuals that captivate? Our template's standout elements include interactive timelines for tracking gold's journey from ancient currency to modern safe-haven asset. Start with the foundational master slides: one minimalist for executive summaries, another bold for deep-dive analyses, and a third hybrid for mixed media integrations like embedding live feeds from trading platforms.
- 28 Specialized Diagrams: From candlestick charts revealing intraday swings to scatter plots correlating gold prices with stock indices, each slide is vector-based for seamless scaling.
- Seven Color Schemes: Choose metallic golds for luxury appeal or cool blues for analytical calm - perfect for adapting to quarterly reports or client proposals.
- Three Background Options: Subtle gradients evoking market waves, textured overlays mimicking bullion surfaces, or clean whites for high-contrast data readability.
- Fully Editable Elements: Swap icons for custom financial symbols, adjust data inputs via Keynote's built-in tools, and animate transitions to simulate price surges.
Compatibility is effortless, working flawlessly with Keynote on macOS and iOS devices. No need for advanced design skills - just drag, drop, and refine to fit your narrative.
Real-World Applications: From Analysis to Persuasion
Financial analysts often grapple with conveying the 'why' behind gold's allure amid economic uncertainty. Use this template to build a slide deck for a client review: Begin with an overview infographic mapping annual averages since 2000, then drill into monthly breakdowns using bar graphs that stack factors like demand from jewelry sectors versus central bank reserves. A researcher presenting at an industry conference might leverage the radar chart to compare gold against other assets like silver or cryptocurrencies, underscoring diversification benefits.
For investors, the template shines in pitch decks. Outline a strategy slide with a funnel diagram: Top-wide for broad market scanning, narrowing to targeted buys during dips. Business professionals in sales can adapt the process flowcharts to illustrate hedging workflows, showing how gold buffers against currency devaluations. Think of a commodities firm executive using these visuals to secure funding - the clarity turns skeptics into partners.
Step-by-Step: Crafting a Gold-Focused Market Update
- Gather Your Data: Pull spot rates from reliable sources and historical trends into a spreadsheet for easy import.
- Select Your Base: Pick a master slide and apply your preferred color scheme to set the tone - warm tones for optimistic forecasts.
- Build Core Slides: Insert a line chart for trends (slide 5), add annotations for pivotal events like the 2020 pandemic surge.
- Add Depth: Incorporate a SWOT analysis matrix (slide 12) tailored to current geopolitical risks.
- Polish and Present: Animate elements for flow, rehearse transitions, and export for seamless sharing.
This workflow cuts prep time, letting you focus on insights rather than formatting. Compared to starting from scratch in Keynote, you'll iterate faster, iterating on feedback without rebuilding layouts.
Expert Tips to Maximize Your Template's Potential
To truly podium-proof your deck, layer in storytelling. Start slides with a hook question: "What if gold's next peak mirrors 2011's record?" Pair it with a dramatic area chart filling the screen. For branding, embed your logo subtly in footers across all 28 diagrams. If presenting virtually, test animations on different devices to ensure smooth playback of rising bar effects mimicking price climbs.
Draw from established practices, like those in Warren Buffett's annual letters, where simple visuals demystify complex holdings. Adapt a similar approach here: Use donut charts for allocation breakdowns, keeping audiences engaged without overwhelming them. And for that extra edge, integrate hyperlinks to live data sources, turning static slides into interactive tools.
Unlock Deeper Insights with Themed Icons and Layouts
Beyond charts, the template's icon library - trowels for mining, scales for valuation - adds context without clutter. Layouts vary from grid-based for multi-metric comparisons to single-focus for emphasis, like a full-bleed world map plotting production hotspots. These elements ensure versatility, whether you're dissecting ETF performances or forecasting based on Fed policies.
In a sales context, visualize ROI with before-and-after sliders: Pre-investment volatility versus post-hedge stability. This not only demonstrates value but builds trust through transparency.
Ready to gold-plate your next presentation? Download the Gold Price Chart Keynote Template today for just $22 and start forging connections that last.
Frequently Asked Questions
What makes these diagrams suitable for gold price analysis?
The diagrams are pre-configured with axes and scales ideal for time-series data, allowing quick input of spot rates and trend lines without manual adjustments.
Can I use this template for non-financial presentations?
Absolutely - adapt the charts for any commodity or market trend by swapping data sets, maintaining the professional aesthetic across industries.
How do the color schemes enhance readability?
Each scheme balances contrast for dark and light modes, with accents that highlight key data points like peaks and troughs.
Is the template compatible with older Keynote versions?
It works with Keynote 2016 and later; for earlier versions, export elements as images to preserve design integrity.
Are animations included in the diagrams?
Yes, subtle build-in effects are built-in for charts, which you can customize or disable based on your presentation style.
Good for
- Project roadmaps and sprint plans
- Product launch timelines
- Quarterly or annual review decks
- Company history and milestone summaries
Licence
reviews
Tried to customize the pie chart colors but it took longer than I thought.
Good for internal meetings, wouldn't use for anything client-facing though.
The slide transitions are a bit dated but the content placeholders are solid.
Needed a org chart fast, this template had a couple decent options.
A few of the diagram connectors didn't align properly, had to tweak them manually.
FAQ
Will it work in Google Slides?
Are fonts embedded?
Can I use this for client work?
What's the refund policy?
Do you update the template after purchase?
Similar templates
See all Keynote templates →


All 1 slides