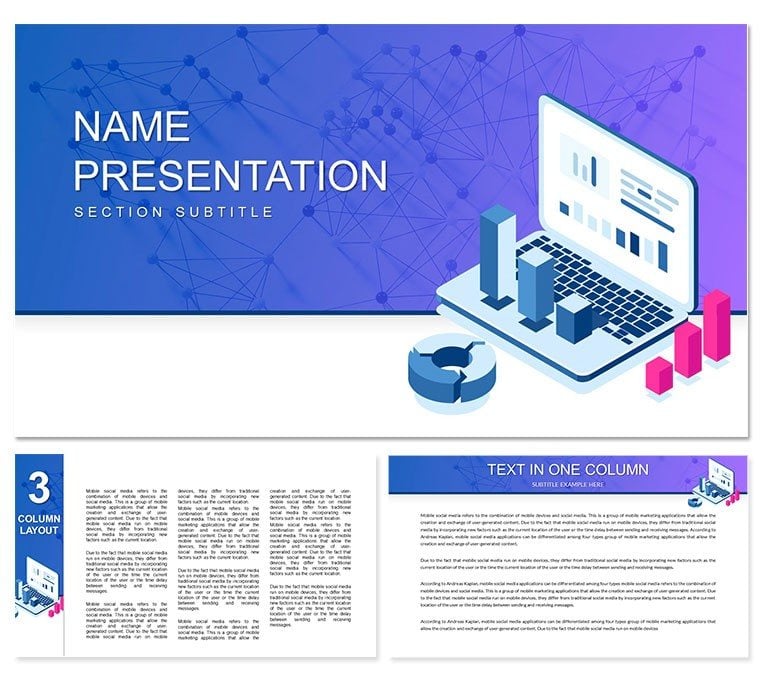
The KPI Meaning Keynote Themes and Diagrams Template simplifies complex data and effectively communicates key performance indicators.
This template is designed with a clean, professional look that improves readability while focusing your audience's attention on the message. It mixes modern visual features with user-friendly layouts, making it appropriate for formal and creative presentations. The template is configurable, so you may change the colors, fonts, icons, and layouts to match your brand identity. It includes pre-made presentations and diagrams illustrating KPIs, allowing you to turn raw data into actionable insights.
This Keynote presentation template, compatible with macOS devices, ensures a professional appearance. Its clean style and ready-to-use slides save you hours of creative work, guaranteeing that your presentation looks professional with minimal effort boosting your confidence in front of your audience.
Purpose
The major purpose of this template is to assist organizations, schools, and professionals in properly presenting KPIs. Whether you're presenting quarterly statistics, operational indicators, or corporate objectives, this template will make your message simple and compelling.
Scope of Use
Perfect for:
- Business professionals
- Analysts
- Project managers
- Educators & Entrepreneurs
This template fits various industries, including banking, marketing, technology, healthcare, and education.
Features and Capabilities
- Pre-designed diagrams: Select from various KPI-specific charts, graphs, and visualizations.
- Modern aesthetics: Sleek designs that will fascinate your audience.
- Customization: Easily modify layouts to match your specific needs.
- Maintain a consistent and professional appearance throughout your presentation.
- Ease of use: Drag-and-drop feature makes editing simple, even for beginners.
Make your KPI presentations stand out using this KPI Meaning Keynote Themes and Diagrams Template. Download it now and turn your data into fascinating stories that get results!