 Zum Vergrößern klicken
Diagramme zur Umsatz- und Ausgabenentwicklung – bearbeitbare PPTX | ImagineLayout
| Format | .pptx |
| Folien | 10 einzigartige Layouts |
| Seitenverhältnis | 130/73 |
| Kompatibilität | PowerPoint |
| Animiert | Nein |
| Sprache | English |
| Lizenz | Commercial |
| Dateigröße | — |
| Version | v1.0 |
| Zuletzt aktualisiert | April 2026 |
Was ist drin
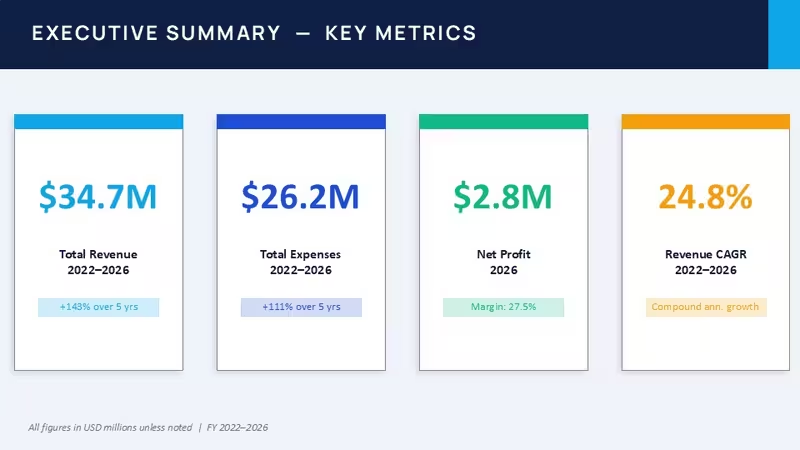
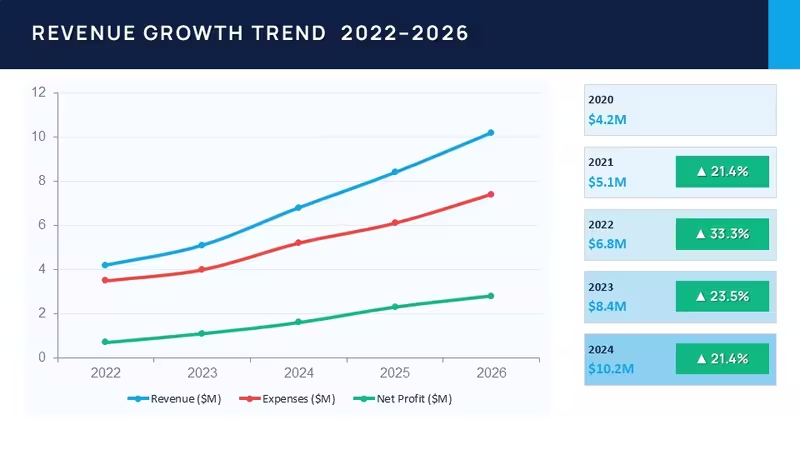
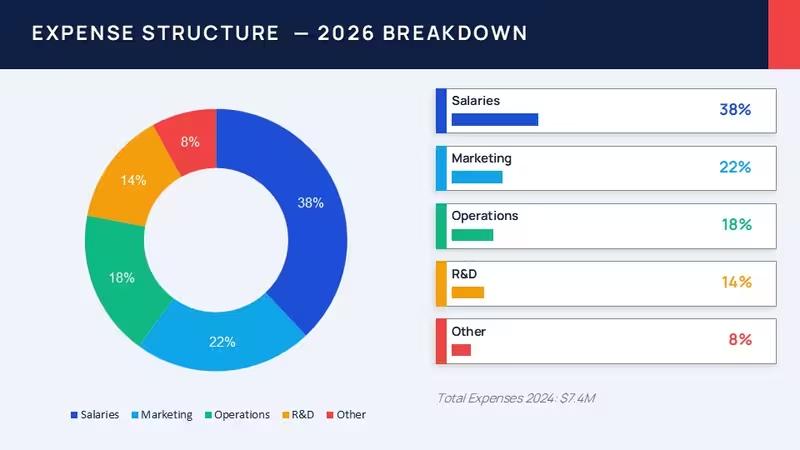
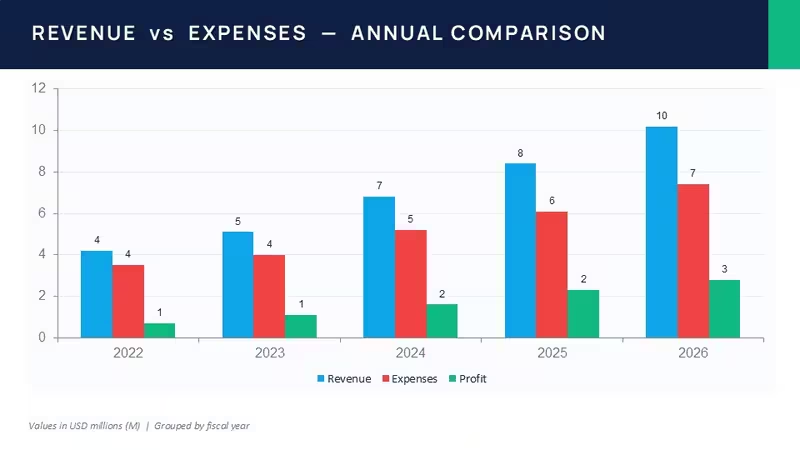
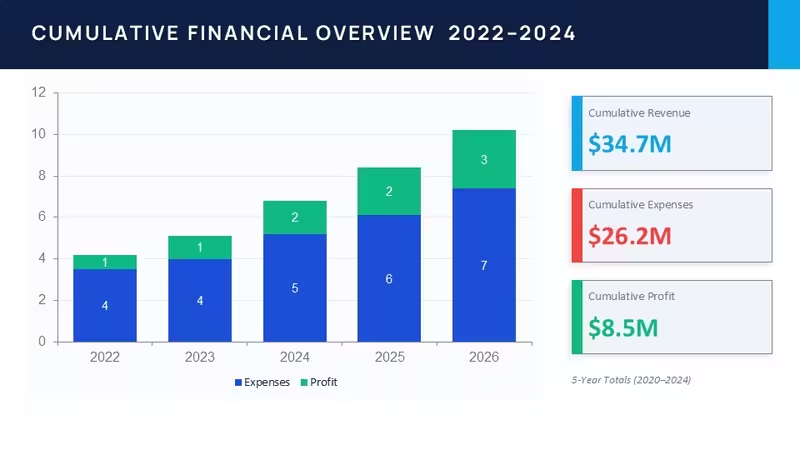
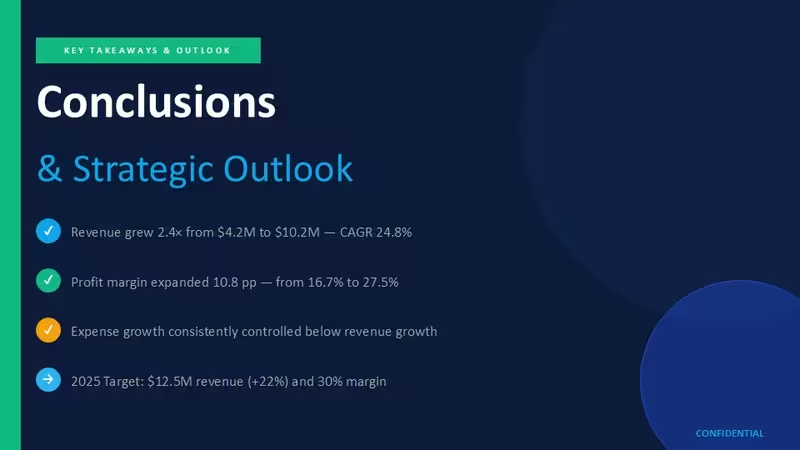
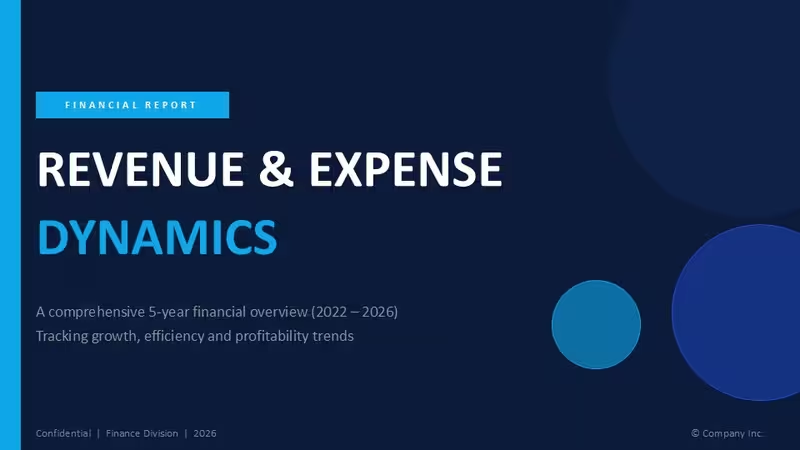
Diagramme zu Umsatz- und Kostendynamik
Geeignet für
- Projekt-Roadmaps und Sprintpläne
- Zeitpläne für Produkteinführungen
- Quartals- oder Jahresberichte
- Unternehmensgeschichte und Meilenstein-Übersichten
Lizenz
Bewertungen
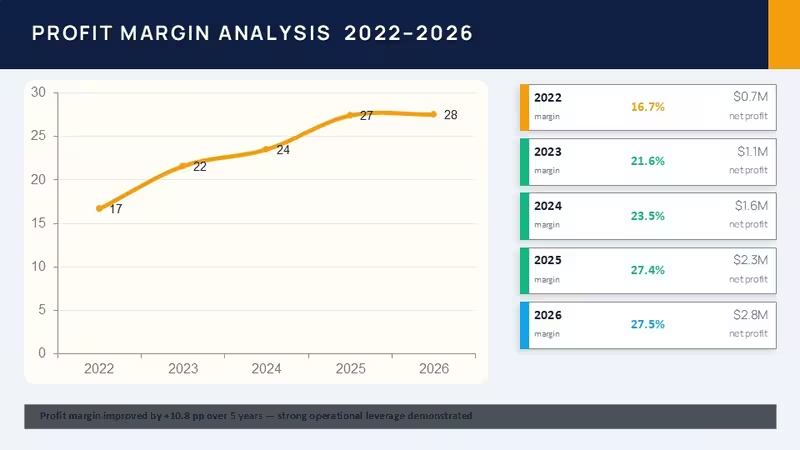
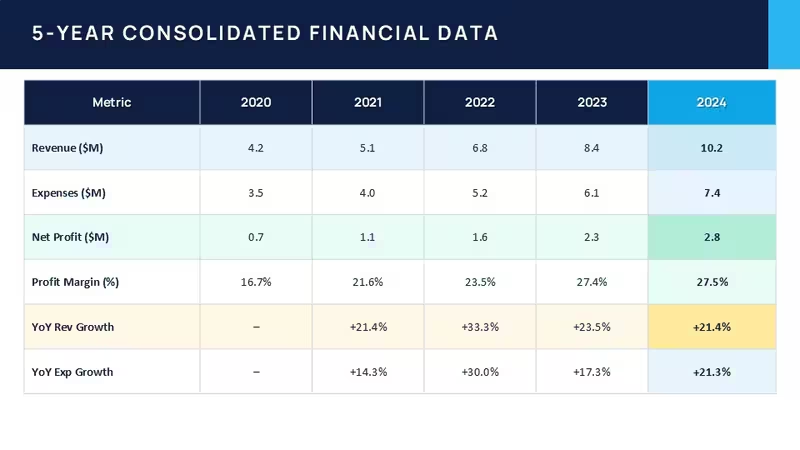
The profit margin analysis table for 2022-2026 and the consolidated data with all the metrics were perfect for a financial analyst report. The horizontal layout lets you scan the years side by side without any hassle.
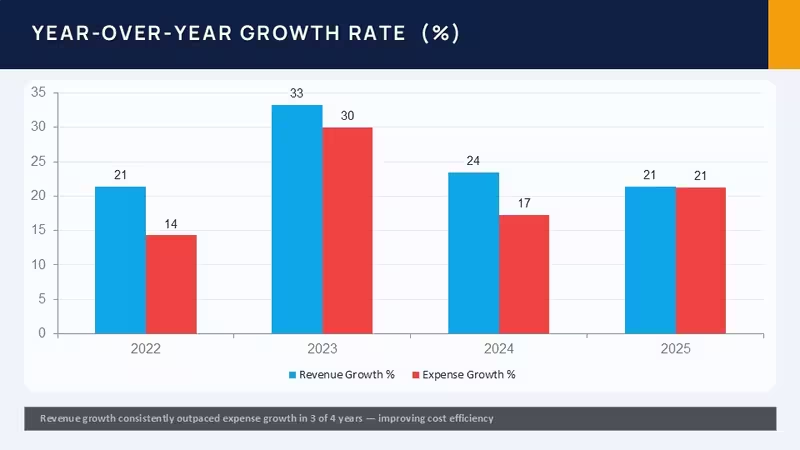
Only 11 slides but they focus on the important stuff like revenue growth and YoY changes. The tables do not feel crowded even when you add more text than you probably should. Spacing is decent.
Not advanced chart types but it shines with tabular financial stuff. The consolidated data tables are well-structured and the columns line up perfectly for quick scanning. The color system updates from the master.
Used this for a quarterly review and the operational leverage analysis worked well. The profit margin part really demonstrates the leverage nicely. You drop in your data and it works as-is.
The teal and grey theme is okay but I always change the colors in the master first. The 5-year consolidated data with all the metrics like revenue growth and YoY changes were already laid out. Took maybe five minutes.
Helfen Sie anderen, indem Sie Ihre Erfahrung teilen. Bewertungen werden nur von registrierten Nutzern angenommen.
Häufige Fragen
Funktioniert die Vorlage in Google Slides?
Sind die Schriften eingebettet?
Darf ich die Vorlage für Kundenprojekte verwenden?
Wie funktioniert die Rückerstattung?
Wird die Vorlage nach dem Kauf aktualisiert?
Ähnliche Vorlagen
Alle ansehen PowerPoint Charts →
Alle 10 Folien