 Click to zoom
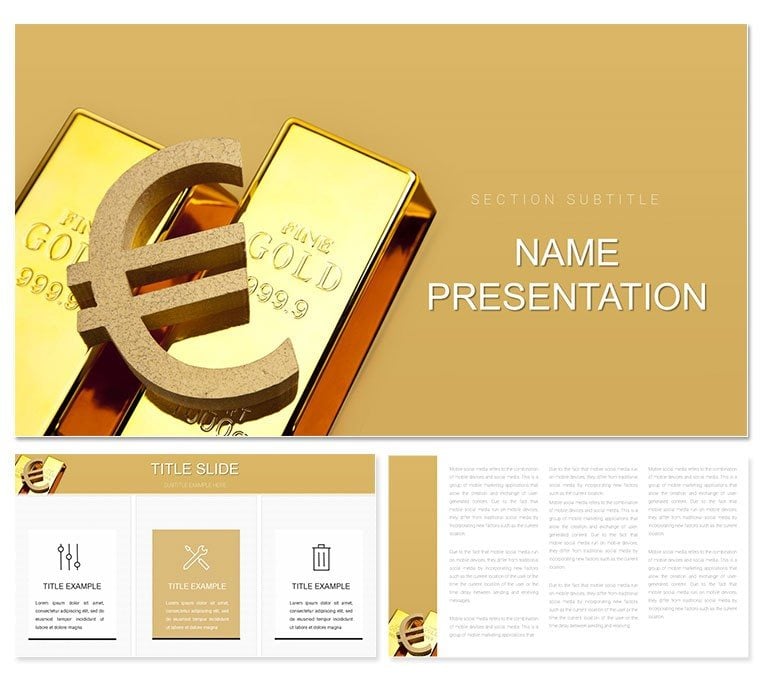
Chart the Golden Path to Economic Clarity with the Gold Spot Price PowerPoint Template
| Format | .pptx |
| Slides | 3 unique layouts |
| Aspect ratio | 16:9 |
| Compatibility | PowerPoint |
| Animated | 否 |
| Language | English |
| License | Commercial |
| File size | — |
| Version | v1.0 |
| Last updated | December 2024 |
What's inside
In the glittering arena of financial markets, where gold's allure sways portfolios and policies, your forecasts demand visuals as timeless as the metal itself. The Gold Spot Price PowerPoint Template is forged for economists, analysts, and investors who seek to demystify price fluctuations, trend analyses, and macroeconomic ties with elegant precision. With 28 sophisticated diagrams, three master layouts, and three opulent backgrounds, it polishes your insights into presentations that gleam with authority.
Whether dissecting daily spot quotes or projecting inflation hedges, this template equips you to spotlight correlations - like gold's dance with interest rates - effortlessly. From PowerPoint 2016 support to versatile formats (.pptx, .potx, .jpg), it's a vault of reliability. Seven color schemes, blending metallic golds with stark blacks, evoke trust and sophistication, mirroring the asset's enduring appeal.
Signature Features for Market Mastery
Refinement defines this template's core, with elements calibrated for economic discourse. Masters include a vault-like title, a trend agenda, and analytical sections that frame data elegantly.
- 28 Insightful Diagrams: Line graphs tracing historical prices, candlestick proxies for volatility, and matrix charts linking to global events - all primed for your inputs.
- Effortless Adaptation: Recast colors for bullish or bearish tones, refine fonts for report-like legibility, and embed live feeds if desired.
- Format Versatility: PPTX for deep dives, POTX for recurring models, JPG for summaries.
These address analyst aches, like rendering bullion bars without bar charts feeling banal. It's the alchemy turning numbers into narratives that hold boardroom weight.
Strategic Applications in Finance and Investing
This template assays excellence in diverse digs. An investment advisor unveiling portfolio diversifications might mine the radial diagrams to radiate gold's role amid equities. For central bankers, layered timelines delineate policy impacts on reserves, forging consensus on stability measures.
Academics could assay theories with comparison slides, pitting gold against fiat in inflationary scenarios. Its scalability suits solo forecasts or ensemble reports, always upholding a professional luster.
Steps to Mint a Market-Beating Deck
- Prospect Your Data: Mine sources like COMEX quotes or Fed announcements for foundational figures.
- Set the Assay: Choose a master and background; subtle ingot motifs underscore without ostentation.
- Embed the Ore: Place a trend line diagram, chart your spots, and calibrate scales for accuracy.
- Polish the Facets: Apply a scheme, ensure decimal precision in labels, and footnote sources.
- Refine the Strike: Preview in presentation mode, honing zooms on peak valuations.
Culled from trading floor traditions, this refines raw intel into refined rhetoric.
Eclipsing Everyday Economic Tools
Stock slides tarnish quickly; this one endures with finance-fitted finesse, from bullion icons to volatility vortices. It harmonizes with Bloomberg pulls, sustaining spot updates dynamically.
For global vistas, multilingual text placeholders bridge borders. It's the bullion standard, elevating econ talks to investment-grade.
Trader's Tips for Golden Gains
- Sequence reveals on price surges to build dramatic arcs, echoing market momentum.
- Select schemes with warm neutrals for fireside chats, cool for formal filings.
- Layer hyperlinks to assay reports, enriching slides with depth.
Seasoned speculators spotlight how such subtlety sways sentiments profoundly.
Stake Your Claim in Economic Narratives Today
Prospect no further - download this template to gild your forecasts with undeniable shine.
Frequently Asked Questions
Can I update charts with real-time data?
Yes, link to Excel for automatic refreshes on spot prices.
Is the design suitable for print reports?
Indeed - high-res vectors ensure sharp outputs on paper or PDF.
How flexible are the color options?
Seven schemes, tweakable to match any financial branding.
Does it include economic icons?
Yes, from charts to currency symbols, all editable.
Compatible with Mac PowerPoint?
Fully, across versions 2016+ for seamless cross-platform use.
Good for
- Project roadmaps and sprint plans
- Product launch timelines
- Quarterly or annual review decks
- Company history and milestone summaries
Licence
reviews
Good for environmental reports, the emissions trend is easy to read.
The renewable energy mix pie chart is useful.
Used the water usage bar chart for a sustainability review.
Simple and works, no complaints.
The biodiversity index comparison is fine.
FAQ
Will it work in Google Slides?
Are fonts embedded?
Can I use this for client work?
What's the refund policy?
Do you update the template after purchase?
Similar templates
See all PowerPoint Templates →


All 1 slides