Venn Keynote charts are collections of professional Venn charts templates, which are impressive in their structure and unusual approaches to design. Truly, elegant variants of Venn chart that embody the creative templates, modern ideas and conclude a top-notch functionality in a simple, uncluttered form. Take the opportunity to purchase and download any of the available Keynote Venn charts.
Create Stunning Presentations with Graph Keynote Charts
$24.00
ID: #KC00930
Successful Start in Business Keynote charts Template
$24.00
ID: #KC00929
Business Process Management Keynote charts
$24.00
ID: #KC00927
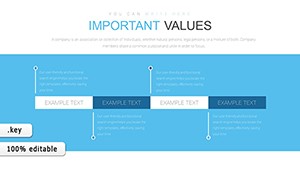
Success chart for Keynote presentation
$24.00
ID: #KC00885
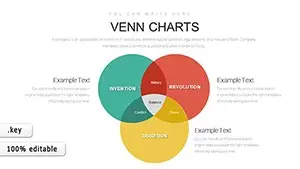
Venn Collection Keynote Charts
$12.00
ID: #KC00873
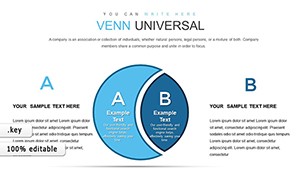
Venn Universal Keynote chart
$18.00
ID: #KC00871
Graphic Venn Keynote charts
$22.00
ID: #KC00870
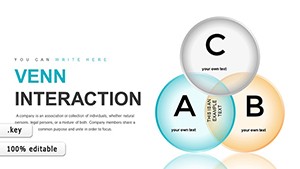
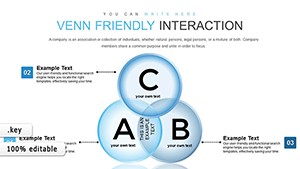
Venn Friendly Interaction Keynote chart template
$22.00
ID: #KC00863
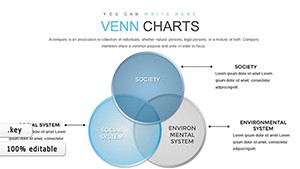
Science Technology and Society Venn Keynote charts
$20.00
ID: #KC00862
Venn Problem Solving Keynote charts
$19.00
ID: #KC00850
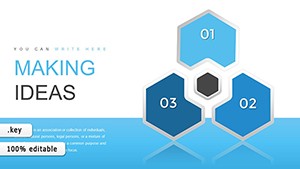
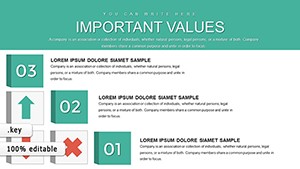
Making Ideas Happen Keynote chart
$15.00
ID: #KC00811
How 3D Venn Keynote Charts Template for Presentation can Elevate Your Presentations
$22.00
ID: #KC00810
Infographic Venn Unions and Intersections Keynote charts Presentation
$18.00
ID: #KC00794
Business Process Modeling Keynote Charts - Professional Template Download
$15.00
ID: #KC00790
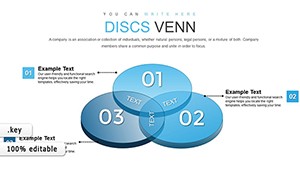
Interactive Venn Keynote chart template
$20.00
ID: #KC00789
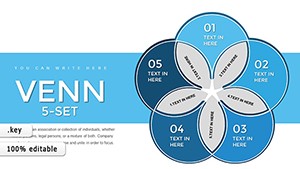
Venn - 5 Set Keynote charts
$22.00
ID: #KC00788
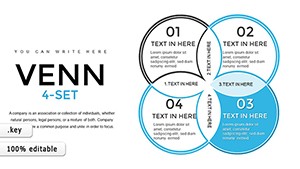
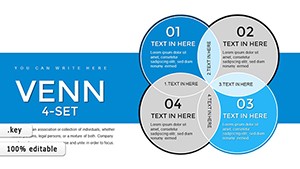
4-Set Venn Keynote Charts Template for Presentation
$22.00
ID: #KC00787
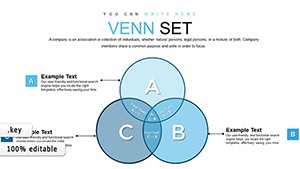
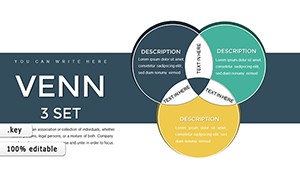
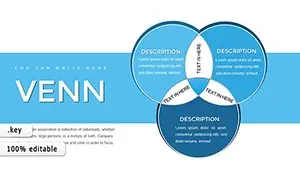
Venn - 3 Set Keynote charts
$22.00
ID: #KC00786
Venn Charts in Keynote presentation
$24.00
ID: #KC00692
Startup Ideas Keynote charts
$27.00
ID: #KC00683
Circuit Service, Ideas and Processes Keynote charts
$18.00
Euler-Venn charts are used to visualize sets and operations on them. The set is represented by a part of the plane bounded by a closed curve; the elements of the set are points (not necessarily all, as, for example, in the case of finite sets) of the plane inside the closed-loop. The original sets are often represented by circles. The only disadvantage of this method of images - you can not depict an empty set.
Using Euler-Venn charts, we represent the union, intersection, difference, and symmetric difference of sets (the formed sets are denoted by hatching).