A workflow PowerPoint diagram provides a graphical overview of a business process or system. This can help prevent bottlenecks by informing team members of goals and deadlines in real-time. Learn how to create your own. A workflow PowerPoint diagram can help prevent project deviations and bottlenecks by communicating goals and deadlines in real time. Whether you're using a workflow diagram for onboarding new requests or optimizing usage and feedback, it's a great way to visualize tasks and data flows.
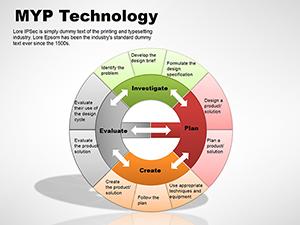
MYP Technology PowerPoint diagrams Template for Presentations
$18.00
ID: #PD00045
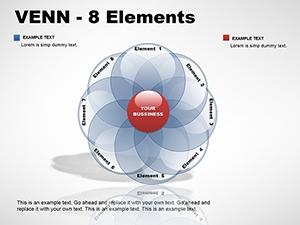
Venn - 8 Elements PowerPoint diagram
$24.00
ID: #PD00039
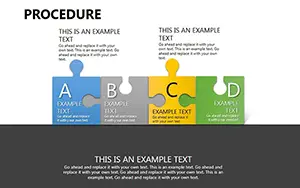
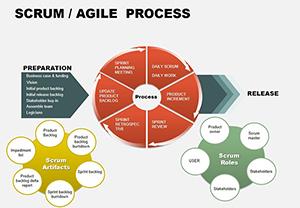
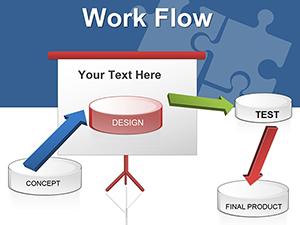
Work Flow PowerPoint diagram template
$24.00
ID: #PD00026
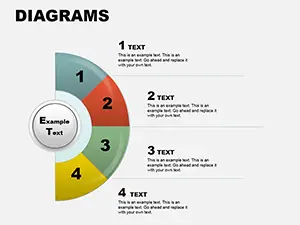
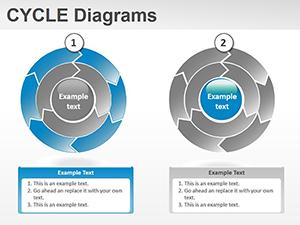
Cycle Diagrams for PowerPoint
$28.00
ID: #PD00017
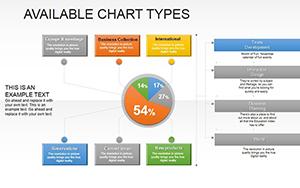
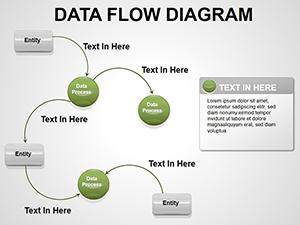
Data Flow PowerPoint diagrams for Presentation
$22.00
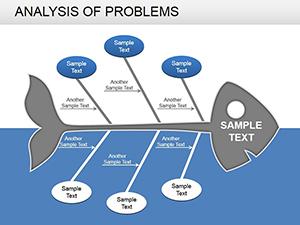
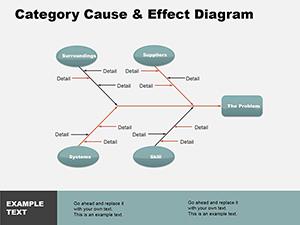
Workflow PowerPoint Diagram – Also known as a workflow diagram, provides a graphical overview of a business process or system. These charts are used to visualize complex designs after initial research is completed. Once you've created a workflow diagram, you'll have a detailed view of high-level tasks and dependencies based on the overall project timeline and goal. These PowerPoint diagrams are closely related to business process mapping, which is used to complete a process from start to finish. The difference between the two is that a process map details the steps, while a workflow diagram gives a visual representation of them.
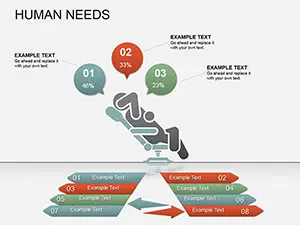
Workflow vs Flowchart
A workflow diagram is a visual representation of a process. This can be a new process that is being created or an existing process that has been modified. Workflow mapping components on your chart using arrows, circles, boxes, ovals, and diamonds to represent each data point.