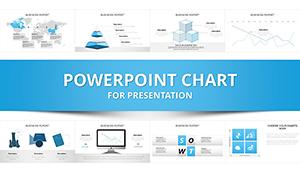
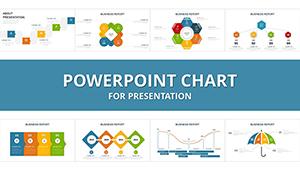
Method PowerPoint Charts
Method Powerpoint Charts templates collection of the most popular vector graphics charts for presentation and projects. PowerPoint charts represent images that can be edited. When using Method charts, you can visually assess the sequence of tasks, their relative duration, the project scope, and detailed analysis of the actual progress of tasks. Here we offer to download some types of PowerPoint Method charts templates for presentations:
ID: #PC01066
Architectural PowerPoint Charts for Presentations | Download Now
ID: #PC00935
Communication Process PowerPoint Charts Template
ID: #PC00920
Propel Finance PowerPoint charts Presentation
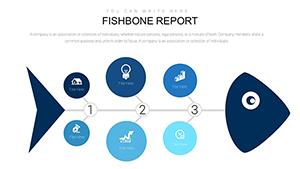
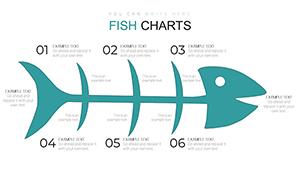
ID: #PC00889
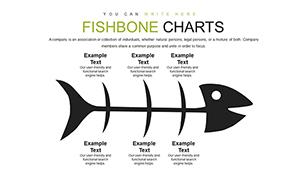
Fishbone PowerPoint charts template for Presentation
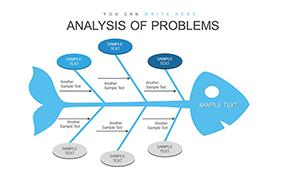
ID: #PC00861
Analysis Of Problems PowerPoint Charts Template - Download Presentation
ID: #PC00859
Sphere Financial Risks PowerPoint Charts Template
ID: #PC00848
Internal And External Destinations PowerPoint Charts Template
ID: #PC00814
PowerPoint Charts Showcasing the Interactionist Perspective
ID: #PC00802
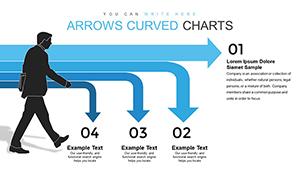
Curved Arrow PowerPoint Charts | Download Template
ID: #PC00800
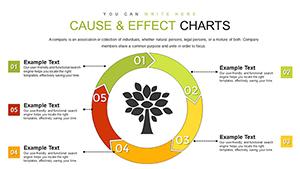
Cause and Effect Tree PowerPoint charts
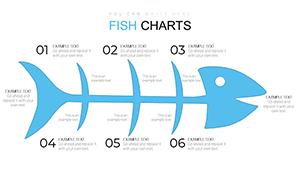
ID: #PC00799
Fish Bone: Easy Way to Find Solution PowerPoint Charts Template
ID: #PC00771
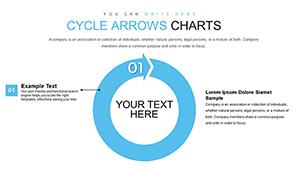
Collection Cycle Arrows PowerPoint Charts Template - Download Now!
ID: #PC00768
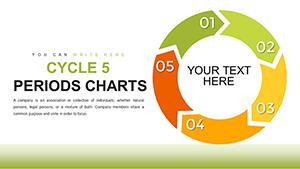
Cycle - 5 Periods PowerPoint Charts Template
ID: #PC00767
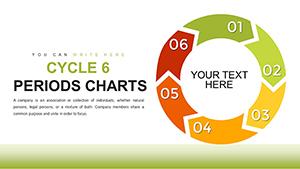
6 Period Cycle PowerPoint Charts | Download Template
ID: #PC00766
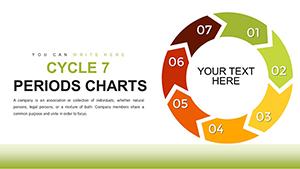
Cycle - 7 Periods PowerPoint Charts Template
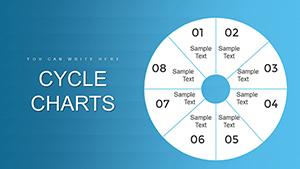
ID: #PC00765
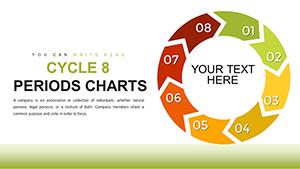
Cycle - 8 Periods PowerPoint Charts | Download Template
ID: #PC00764
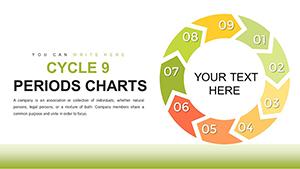
Cycle - 9 Periods PowerPoint Charts Template for Presentation
ID: #PC00763
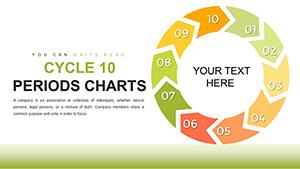
Cycle - 10 Periods PowerPoint charts
ID: #PC00762
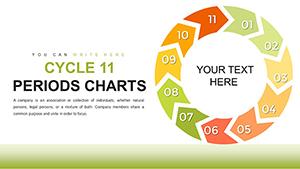
Cycle 11 Periods PowerPoint Charts Template Download | Presentation PPTX
ID: #PC00761
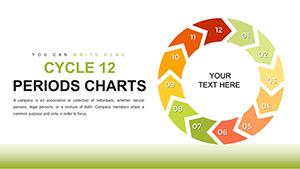
12 Cycle Periods PowerPoint Charts Template
ID: #PC00733
Ishikawa Cause-Effect PowerPoint Charts Template | Presentation
ID: #PC00732
Cause and Effect Fishbone PowerPoint Charts - Professional Presentation Template
ID: #PC00731
Analysis Ishikawa Fishbone PowerPoint Charts Template
ID: #PC00706
8 Segment Cycle PowerPoint Charts Template