Finance Icons PowerPoint Diagrams Financial Presentations

#0
#1
#2
#3
#4
#5
#6
#7
#8
#9
#10
#11
#12
#13
  • thumbnail slide #0
  • thumbnail slide #1
  • thumbnail slide #2
  • thumbnail slide #3
  • thumbnail slide #4
  • thumbnail slide #5
  • thumbnail slide #6
  • thumbnail slide #7
  • thumbnail slide #8
  • thumbnail slide #9
  • thumbnail slide #10
  • thumbnail slide #11
  • thumbnail slide #12
  • thumbnail slide #13

Type: PowerPoint Diagrams template

Category: Analysis

Sources Available: .pptx

Product ID: PD00133

Template incl.: 14 editable slides

Purchase this template
$ 18.00

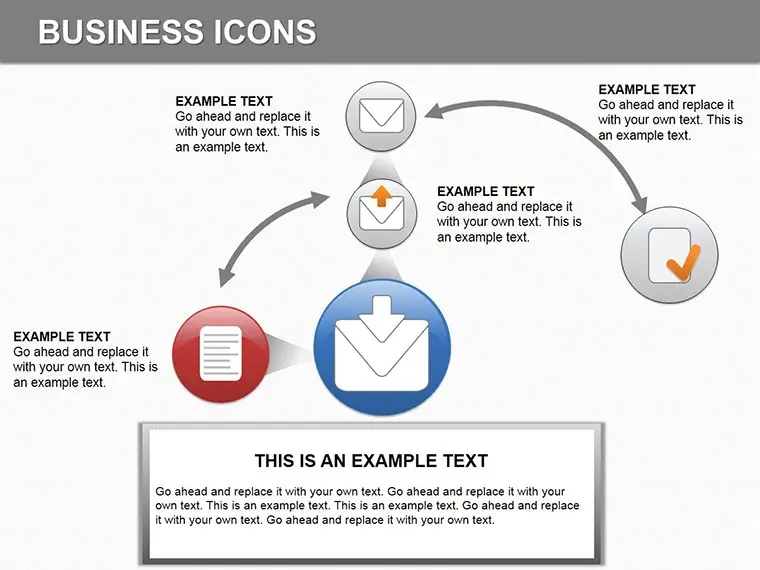
Financial icons and diagrams are essential tools for creating effective presentations on a variety of financial topics. They can help to clarify complex concepts, make your presentations more visually appealing, and improve audience retention.

There are many different types of financial icons and diagrams available, so you can find the perfect ones to fit your needs. Some common examples include:

  • Charts and graphs: These can be used to illustrate trends, relationships, and other data.
  • Tables: These can be used to present information clearly and concisely.
  • Icons: These can be used to represent concepts or ideas.

When choosing financial icons and diagrams for your presentations, it is important to consider the following:

  • Your audience: What level of understanding do they have of the topic?
  • The purpose of your presentation: What are you trying to achieve?
  • The overall style of your presentation: Do you want to use a formal or informal tone?

Once you have chosen your icons and diagrams, it is important to use them effectively. Here are a few tips:

  • Keep your icons and diagrams simple and easy to understand.
  • Use them sparingly to avoid cluttering your slides.
  • Label your icons and diagrams clearly so that your audience knows what they represent.

By using financial icons and diagrams effectively, you can create presentations that are clear, concise, and engaging.

Here are some specific examples of how financial icons and diagrams can be used in presentations:

  • A presentation on the stock market could use charts and graphs to show trends in stock prices, tables to compare the performance of different stocks, and icons to represent different types of investments.
  • A presentation on budgeting could use icons to represent different types of expenses, tables to show how much money is being spent in each category, and charts to track spending over time.
  • A presentation on marketing could use icons to represent different types of marketing campaigns, tables to show the results of different campaigns, and charts to track the growth of a company's customer base.

By using financial icons and diagrams in your presentations, you can make your information more accessible and engaging for your audience.

Work Flow PowerPoint diagram template
ID: #PD00039
Work Flow PowerPoint diagram template
Presentation Making Ideas PowerPoint diagram template
ID: #PD00132
Presentation Making Ideas PowerPoint diagram template
Tourist Services PowerPoint diagram Template
ID: #PD00131
Tourist Services PowerPoint diagram Template
Bootstrap Mockups PowerPoint Diagram Template
ID: #PD00181
Bootstrap Mockups PowerPoint Diagram Template
Table Descriptions PowerPoint diagrams
ID: #PD00183
Table Descriptions PowerPoint diagrams
Interactive Lessons PowerPoint Template for Presentation
ID: #PD00149
Interactive Lessons PowerPoint Template for Presentation
Cycle Period PowerPoint diagrams
ID: #PD00006
Cycle Period PowerPoint diagrams
Fishbone PowerPoint diagram template
ID: #PD00029
Fishbone PowerPoint diagram template