


Type: PowerPoint Charts template
Category: Venn
Sources Available: .pptx
Product ID: PC00490
Template incl.: 17 editable slides
In today's fast-paced world, where every second counts, the use of visual aids has become essential in presentations. PowerPoint is the go-to tool for creating professional-looking slideshows that grab the audience's attention. Flow Venn PowerPoint Charts are an excellent way to present complex information in a clear and concise manner. This article will provide a comprehensive guide to using the Flow Venn PowerPoint Charts Template.
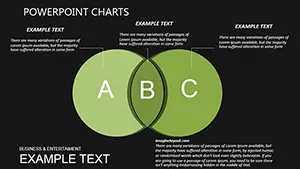
Flow Venn PowerPoint Charts are graphical representations of data that display relationships between various sets of data. These charts are made up of overlapping circles that represent each set, with the intersection of the circles representing the data that is common to both sets. Flow Venn Charts are perfect for illustrating concepts such as market segmentation, product analysis, and social network analysis.
Flow Venn PowerPoint Charts have several advantages over other chart types, including:
1. Easy to understand
Flow Venn Charts are easy to understand, even for people who are not familiar with data analysis. The use of overlapping circles makes it easy to see the relationships between sets of data.
2. Flexibility
Flow Venn Charts are flexible and can be used to display any data that can be categorized into sets.
3. Clarity
Flow Venn Charts provide a clear visual representation of data, making it easy to identify patterns and trends.
4. Versatility
Flow Venn Charts can be used for a variety of applications, including marketing, research, and education.
Here are some tips for creating effective Flow Venn PowerPoint Charts:
1. Keep it Simple
Keep the chart simple and easy to read. Avoid using too many colors or complex designs.
2. Label Clearly
Make sure to label each circle clearly and use a font size that is easy to read.
3. Use Relevant Data
Use only relevant data that supports your message.
4. Use Animation Effects
Use animation effects to highlight important points and make the chart more engaging.
5. Test Your Chart
Test your chart by presenting it to a small group of people and getting feedback.
Flow Venn PowerPoint Charts is a powerful tool for presenting complex data in a clear and concise manner. By following the steps outlined in this article, you can create effective Flow Venn Charts that will grab your audience's attention and help you communicate your message effectively.


Copyright © 2009-2024 ImagineLayout All rights reserved.