


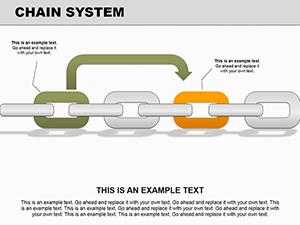
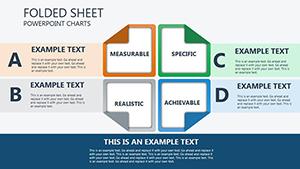
Squares With Arrows PowerPoint Charts Template. A great way to visualize your data clearly and concisely. The squares and arrows make it easy to see the relationships between different pieces of information. Perfect for presentations on business, marketing, education, and more.
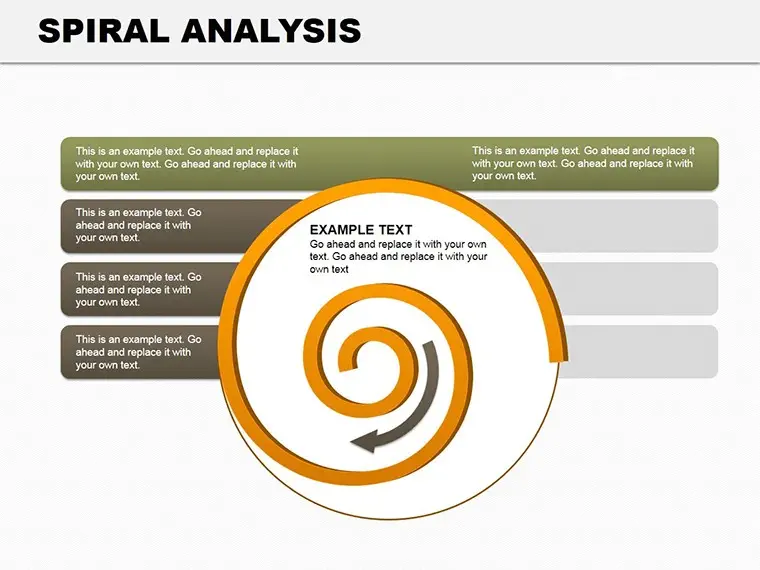
Revolutionize your presentations with our editable Spiral Analysis PowerPoint Charts Template. Infuse creativity into data visualization, making your content engaging and insightful. Ideal for professionals seeking impactful presentations.
In the realm of presentations, where visual appeal meets informative content, our Spiral Analysis PowerPoint Charts Template stands as a game-changer. Crafted with precision and an eye for detail, this template is more than just a set of slides - it's a tool to elevate your communication.
Background and Design:
The template boasts a modern and clean design, ensuring that your data takes center stage without overwhelming your audience. The subtle color palette enhances readability, maintaining a professional yet visually appealing aesthetic. With a focus on user-friendly customization, you can effortlessly tailor each slide to match your unique style.
Main Characteristics:
Color Palette:
The carefully chosen color palette strikes the perfect balance - professional and vibrant. Subdued tones ensure readability, while pops of color add an element of visual interest. Whether you're presenting financial data or project milestones, the color scheme adapts to the content seamlessly.
Versatility in Use:
Designed for professionals across various industries, the template finds its place in boardrooms, classrooms, and conferences. Marketers can utilize it to showcase market trends, educators can simplify complex topics, and project managers can present timelines with clarity.
Why You Need It:
In the fast-paced world of presentations, grabbing and retaining attention is crucial. The Spiral Analysis PowerPoint Charts Template is not just a set of slides; it's a strategic tool to communicate effectively. Your data becomes a story, and your audience becomes engaged participants in that narrative.
Empower your presentations with the Spiral Analysis PowerPoint Charts Template - where innovation meets functionality. Whether you're a seasoned professional or a newcomer to the presentation scene, this template adds that extra layer of impact, making your message memorable and influential. Download it now and witness the transformation in your presentation game.


Copyright © 2009-2024 ImagineLayout All rights reserved.