


Enhance your presentations with our BCG Matrix PowerPoint charts. Download our professional infographic templates for captivating presentations. Suitable for businesses and professionals.
In the world of business, making informed strategic decisions is crucial for the success and growth of any organization. To aid in this process, numerous frameworks and tools have been developed over the years. One such tool that has stood the test of time is the BCG Matrix, also known as the Growth-Share Matrix. When it comes to presenting and analyzing the data derived from the BCG Matrix, PowerPoint charts have become an indispensable tool. In this article, we will explore the BCG Matrix and delve into the benefits and uses of incorporating PowerPoint charts to visualize and communicate this valuable information.
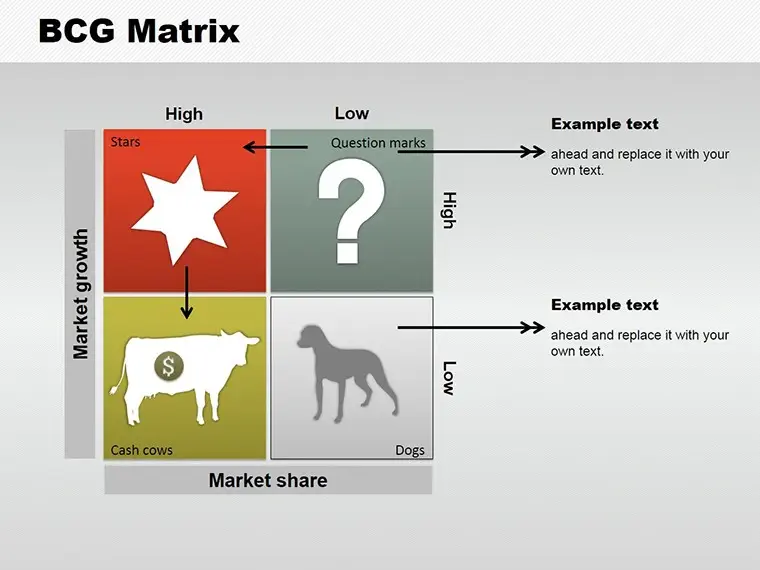
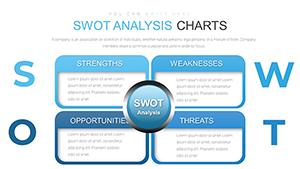
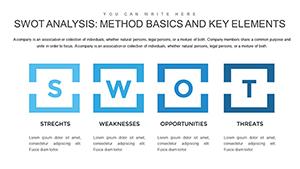
The BCG Matrix, developed by the Boston Consulting Group, is a strategic planning framework used to analyze a company's portfolio of products or business units. It provides a visual representation of the company's offerings, categorizing them into four quadrants: Stars, Cash Cows, Question Marks, and Dogs.
Welcome to our collection of BCG Matrix PowerPoint charts. If you're looking to elevate the impact of your presentations, our professionally designed infographic templates are here to help. With our visually appealing and customizable slides, you can effectively communicate complex ideas, analyze market growth, and make informed business decisions.
Our BCG Matrix PowerPoint charts provide a comprehensive framework to analyze your business portfolio and identify growth opportunities. Whether you're a consultant, marketer, or business professional, these templates enable you to showcase data-driven insights in a visually engaging manner. From strategic planning to product management, our presentation templates offer the flexibility to meet your specific needs.
We understand that every presentation is unique, and that's why our templates are highly customizable. With just a few clicks, you can modify colors, fonts, and layouts to match your branding and content requirements. Our user-friendly interface ensures a seamless editing experience, even for those with limited design skills. Say goodbye to the hassle of starting from scratch and save valuable time with our ready-to-use templates.
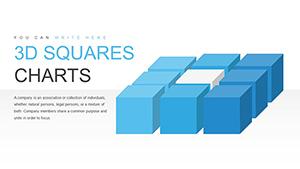
Our collection offers a wide range of BCG Matrix charts to cater to different presentation styles and preferences. Whether you prefer a minimalist design or a vibrant and eye-catching layout, we have templates that will suit your taste. Each slide is meticulously crafted to convey information effectively, allowing you to captivate your audience and leave a lasting impression.
Ready to take your presentations to the next level? Download our BCG Matrix PowerPoint charts today and unlock the potential of visual storytelling. Impress your clients, colleagues, and stakeholders with compelling data visualizations and deliver impactful presentations that drive results. Don't settle for ordinary slides – choose our professional templates for extraordinary presentations.
The BCG Matrix is a powerful framework for analyzing an organization's product or business unit portfolio. To effectively communicate this valuable information, PowerPoint charts have become an indispensable tool. By employing these visual aids, businesses can present complex data in a simplified and engaging manner, enabling stakeholders to make informed strategic decisions. Whether you are conducting internal presentations, pitching ideas to potential investors, or facilitating strategic discussions, incorporating PowerPoint charts into your BCG Matrix analysis can greatly enhance communication and understanding, ultimately leading to better business outcomes.
Copyright © 2009-2024 ImagineLayout All rights reserved.