Presentations with Tree Analysis Keynote Diagrams

#0
#1
#2
#3
#4
#5
#6
#7
#8
#9
#10
#11
#12
#13
#14
#15
#16
#17
#18
#19
#20
#21
  • thumbnail slide #0
  • thumbnail slide #1
  • thumbnail slide #2
  • thumbnail slide #3
  • thumbnail slide #4
  • thumbnail slide #5
  • thumbnail slide #6
  • thumbnail slide #7
  • thumbnail slide #8
  • thumbnail slide #9
  • thumbnail slide #10
  • thumbnail slide #11
  • thumbnail slide #12
  • thumbnail slide #13
  • thumbnail slide #14
  • thumbnail slide #15
  • thumbnail slide #16
  • thumbnail slide #17
  • thumbnail slide #18
  • thumbnail slide #19
  • thumbnail slide #20
  • thumbnail slide #21

Type: Keynote Diagrams template

Category: Hierarchy

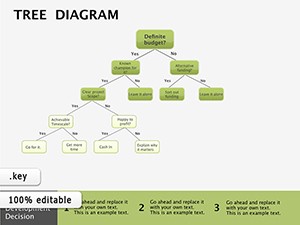
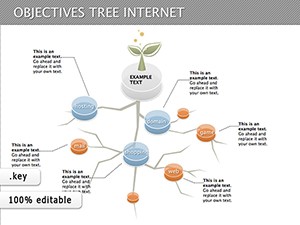
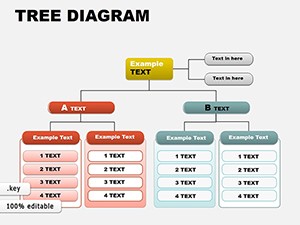
Sources Available: .key

Product ID: KD00074

Template incl.: 22 editable slides

Purchase this template
$ 22.00

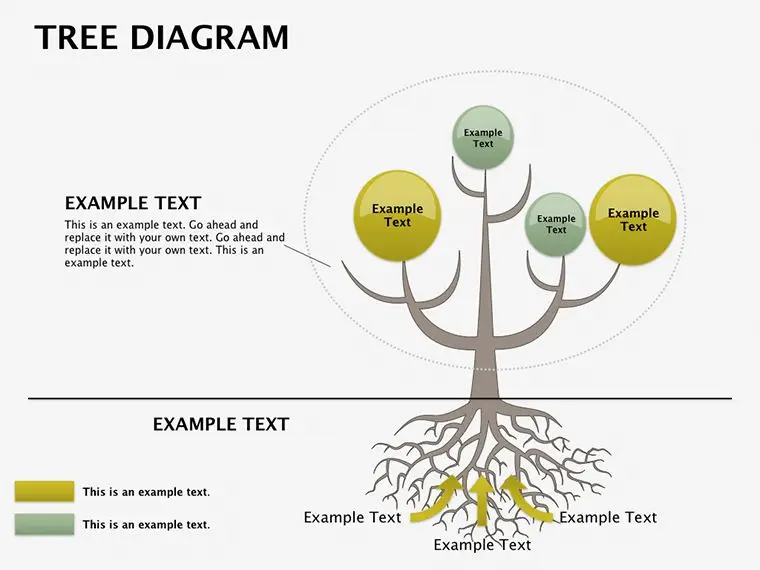
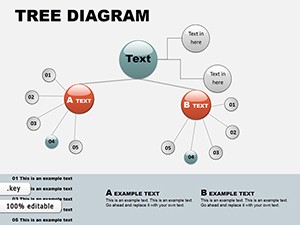
Enhance your presentations with customizable Tree Analysis Keynote Diagrams. Engaging visuals for data analysis and decision-making. Perfect for professionals and educators. Welcome to our comprehensive collection of Tree Analysis Keynote Diagrams, designed to elevate your presentation game to new heights. In this digital era, creating captivating and informative slides is crucial for making an impact and conveying complex information effectively. Our top-notch Keynote Diagrams offer a versatile and customizable solution that suits professionals, educators, and anyone seeking to deliver compelling messages.

Why Choose Tree Analysis Keynote Diagrams:

  1. Empowering Data Analysis: Unlock the potential of data-driven decision-making with our Tree Analysis Keynote Diagrams. Visually present data hierarchies, dependencies, and relationships making complex information easily digestible.
  2. Unparalleled Customization: Tailor each diagram to suit your specific needs and branding. With a wide range of options for colors, fonts, and layouts, your presentations will reflect your unique style and message.
  3. Effortless Visual Communication: Communicate ideas more efficiently through clear and intuitive visuals. Tree Analysis Diagrams provide a clear roadmap for your audience, facilitating better comprehension and engagement.
  4. Ideal for Professionals: Whether you are a business analyst, consultant, or project manager, our Keynote Diagrams are the perfect aid for your reports, strategic plans, and presentations.
  5. Educators' Best Friend: Teachers and professors can captivate students with interactive and educational presentations. Simplify complex concepts and foster better learning experiences.

Personalized Solutions for Your Needs:
We understand that each project is unique. Therefore, we offer tailored solutions for every presentation requirement. Our Tree Analysis Keynote Diagrams can be seamlessly integrated into various topics, from business analysis to academic research.

Efficiency and Ease of Use:
Our Keynote Diagrams are designed with a user-friendly interface, allowing you to create impactful presentations efficiently. Save time and effort without compromising on quality, leaving you more time to focus on perfecting your message.

Whether you are a professional seeking to make data analysis more accessible or an educator aiming to deliver compelling lessons, our Tree Analysis Keynote Diagrams will exceed your expectations. Elevate your presentations and captivate your audience with engaging visuals and seamless customization options. Embrace the power of visual communication and make your mark today!

Tree Block diagram for Keynote
ID: #KD00083
Tree Block diagram for Keynote
Objectives Tree Internet Keynote diagram
ID: #KD00113
Objectives Tree Internet Keynote diagram
Lamp Idea Keynote diagrams
ID: #KD00043
Lamp Idea Keynote diagrams
Organizational Tree Keynote diagrams
ID: #KD00057
Organizational Tree Keynote diagrams
Tree - Circular Keynote diagram
ID: #KD00060
Tree - Circular Keynote diagram
Labyrinth Keynote diagrams Templates Presentation
ID: #KD00072
Labyrinth Keynote diagrams Templates Presentation
Apple Keynote diagrams
ID: #KD00093
Apple Keynote diagrams
Volatility and Pyramid Keynote diagram
ID: #KD00114
Volatility and Pyramid Keynote diagram