


This Keynote template includes a variety of BCG Matrix charts that you can use to create a professional presentation. The charts are easy to edit and customize, and they are compatible with Keynote.
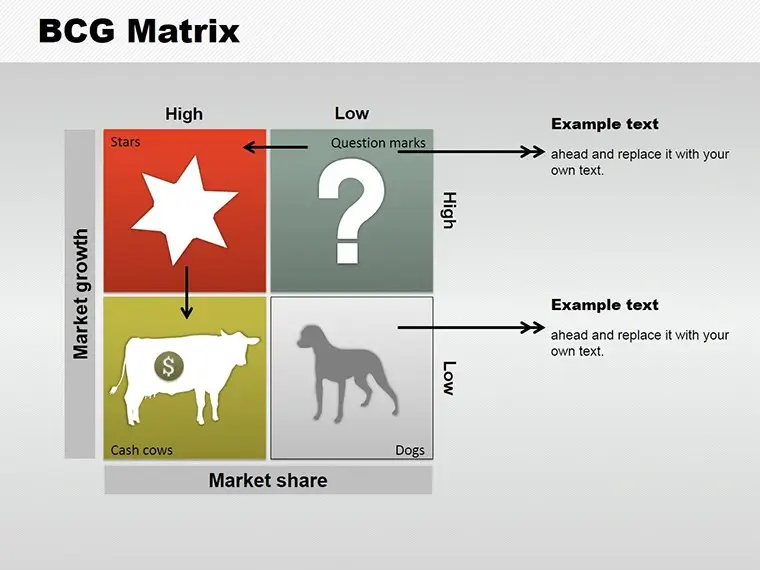
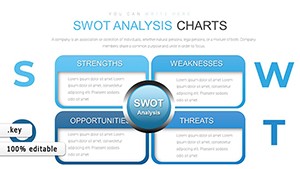
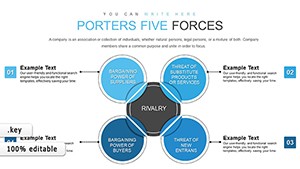
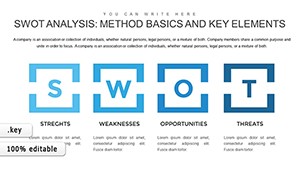
The BCG Matrix, also known as the Boston Consulting Group Matrix, is a strategic planning tool that helps businesses analyze their product portfolio and make decisions about resource allocation. The matrix is a four-quadrant grid, with each quadrant representing a different stage in the product life cycle. The four quadrants are:
The BCG Matrix can be used to help businesses make decisions about which products to invest in, which products to divest, and which products to harvest.
This template includes a variety of BCG Matrix Keynote Charts that you can use to create a professional presentation. The charts are easy to edit and customize, and they are compatible with Keynote.

Copyright © 2009-2024 ImagineLayout All rights reserved.